We stand with our friends and colleagues in Ukraine.
To support Ukraine in their time of need
We stand with our friends and colleagues in Ukraine.
To support Ukraine in their time of need
Frontend/UI Configuration
Configuration
Several aspects of the UI can be configured:
- The Dependencies section can be enabled / configured
- The Monitor tab (aka: Service Performance Monitoring) can be enabled / configured
- App analytics tracking can be enabled / configured (via Google Analytics or custom plugin)
- Additional menu options can be added to the global nav
- Search input limits can be configured
These options can be configured by a JSON configuration file. The --query.ui-config command line parameter of the query service must then be set to the path to the JSON file when the query service is started.
An example configuration file (see complete schema here ):
{
  "dependencies": {
    "dagMaxNumServices": 200,
    "menuEnabled": true
  },
  "monitor": {
    "menuEnabled": true
  },
  "archiveEnabled": true,
  "tracking": {
    "gaID": "UA-000000-2",
    "trackErrors": true
  },
  "menu": [
    {
      "label": "About Jaeger",
      "items": [
        {
          "label": "GitHub",
          "url": "https://github.com/jaegertracing/jaeger"
        },
        {
          "label": "Docs",
          "url": "http://jaeger.readthedocs.io/en/latest/"
        }
      ]
    }
  ],
  "search": {
    "maxLookback": {
      "label": "2 Days",
      "value": "2d"
    },
    "maxLimit": 1500
  },
  "linkPatterns": [{
    "type": "process",
    "key": "jaeger.version",
    "url": "https://github.com/jaegertracing/jaeger-client-java/releases/tag/#{jaeger.version}",
    "text": "Information about Jaeger release #{jaeger.version}"
  },
  {
    "type": "tags",
    "key": "uniqueId",
    "url": "https://mykibana.com/uniqueId=#{uniqueId}&traceId=#{trace.traceID}",
    "text": "Redirect to kibana to view log"
  }]
}
Dependencies
dependencies.dagMaxNumServices defines the maximum number of services allowed before the DAG dependency view is disabled. Default: 200.
dependencies.menuEnabled enables (true) or disables (false) the dependencies menu button. Default: true.
Monitor
monitor.menuEnabled enables (true) or disables (false) the Monitor menu button. Default: false.
Archive Support
archiveEnabled enables (true) or disables (false) the archive traces button. Default: false. It requires a configuration of an archive storage in Query service. Archived traces are only accessible directly by ID, they are not searchable.
App Analytics Tracking
tracking.gaID defines the Google Analytics tracking ID. This is required for Google Analytics tracking, and setting it to a non-null value enables Google Analytics tracking. Default: null.
tracking.customWebAnalytics defines a factory function for a custom tracking plugin (only when using Javascript-form of UI configuration).
tracking.trackErrors enables (true) or disables (false) error tracking. Errors can only be tracked if a valid analytics tracker is configured. Default: true.
For additional details on app analytics see the tracking README in the UI repo.
Custom Menu Items
menu allows additional links to be added to the global nav. The additional links are right-aligned.
In the sample JSON config above, the configured menu will have a dropdown labeled “About Jaeger” with sub-options for “GitHub” and “Docs”. The format for a link in the top right menu is as follows:
{
  "label": "Some text here",
  "url": "https://example.com"
}
Links can either be members of the menu Array, directly, or they can be grouped into a dropdown menu option. The format for a group of links is:
{
  "label": "Dropdown button",
  "items": [ ]
}
The items Array should contain one or more link configurations.
Search Input Limit
The search.maxLimit configures the maximum results that the input let you search.
The search.maxLookback configures the maximum time before the present users can query for traces. The options in the Lookback dropdown greater than this value will not be shown.
| Field | Description |
|---|---|
| label | The text displayed in the search form dropdown |
| value | The value submitted in the search query if the label is selected |
Link Patterns
The linkPatterns node can be used to create links from fields displayed in the Jaeger UI.
| Field | Description |
|---|---|
| type | The metadata section in which your link will be added: process, tags, logs, traces |
| key | The name of tag/process/log attribute which value will be displayed as a link, this field is not necessary for type traces. |
| url | The URL where the link should point to, it can be an external site or relative path in Jaeger UI |
| text | The text displayed in the tooltip for the link |
Both url and text can be defined as templates (i.e. using #{field-name}) where Jaeger UI will dynamically substitute values based on tags/logs/traces data.
For traces, the supported template fields are: duration, endTime, startTime, traceName and traceID.
Further, the trace template fields are available for substitution in process/logs/tags type when the trace template fields are prefixed with trace.. For example: trace.traceID, trace.startTime.
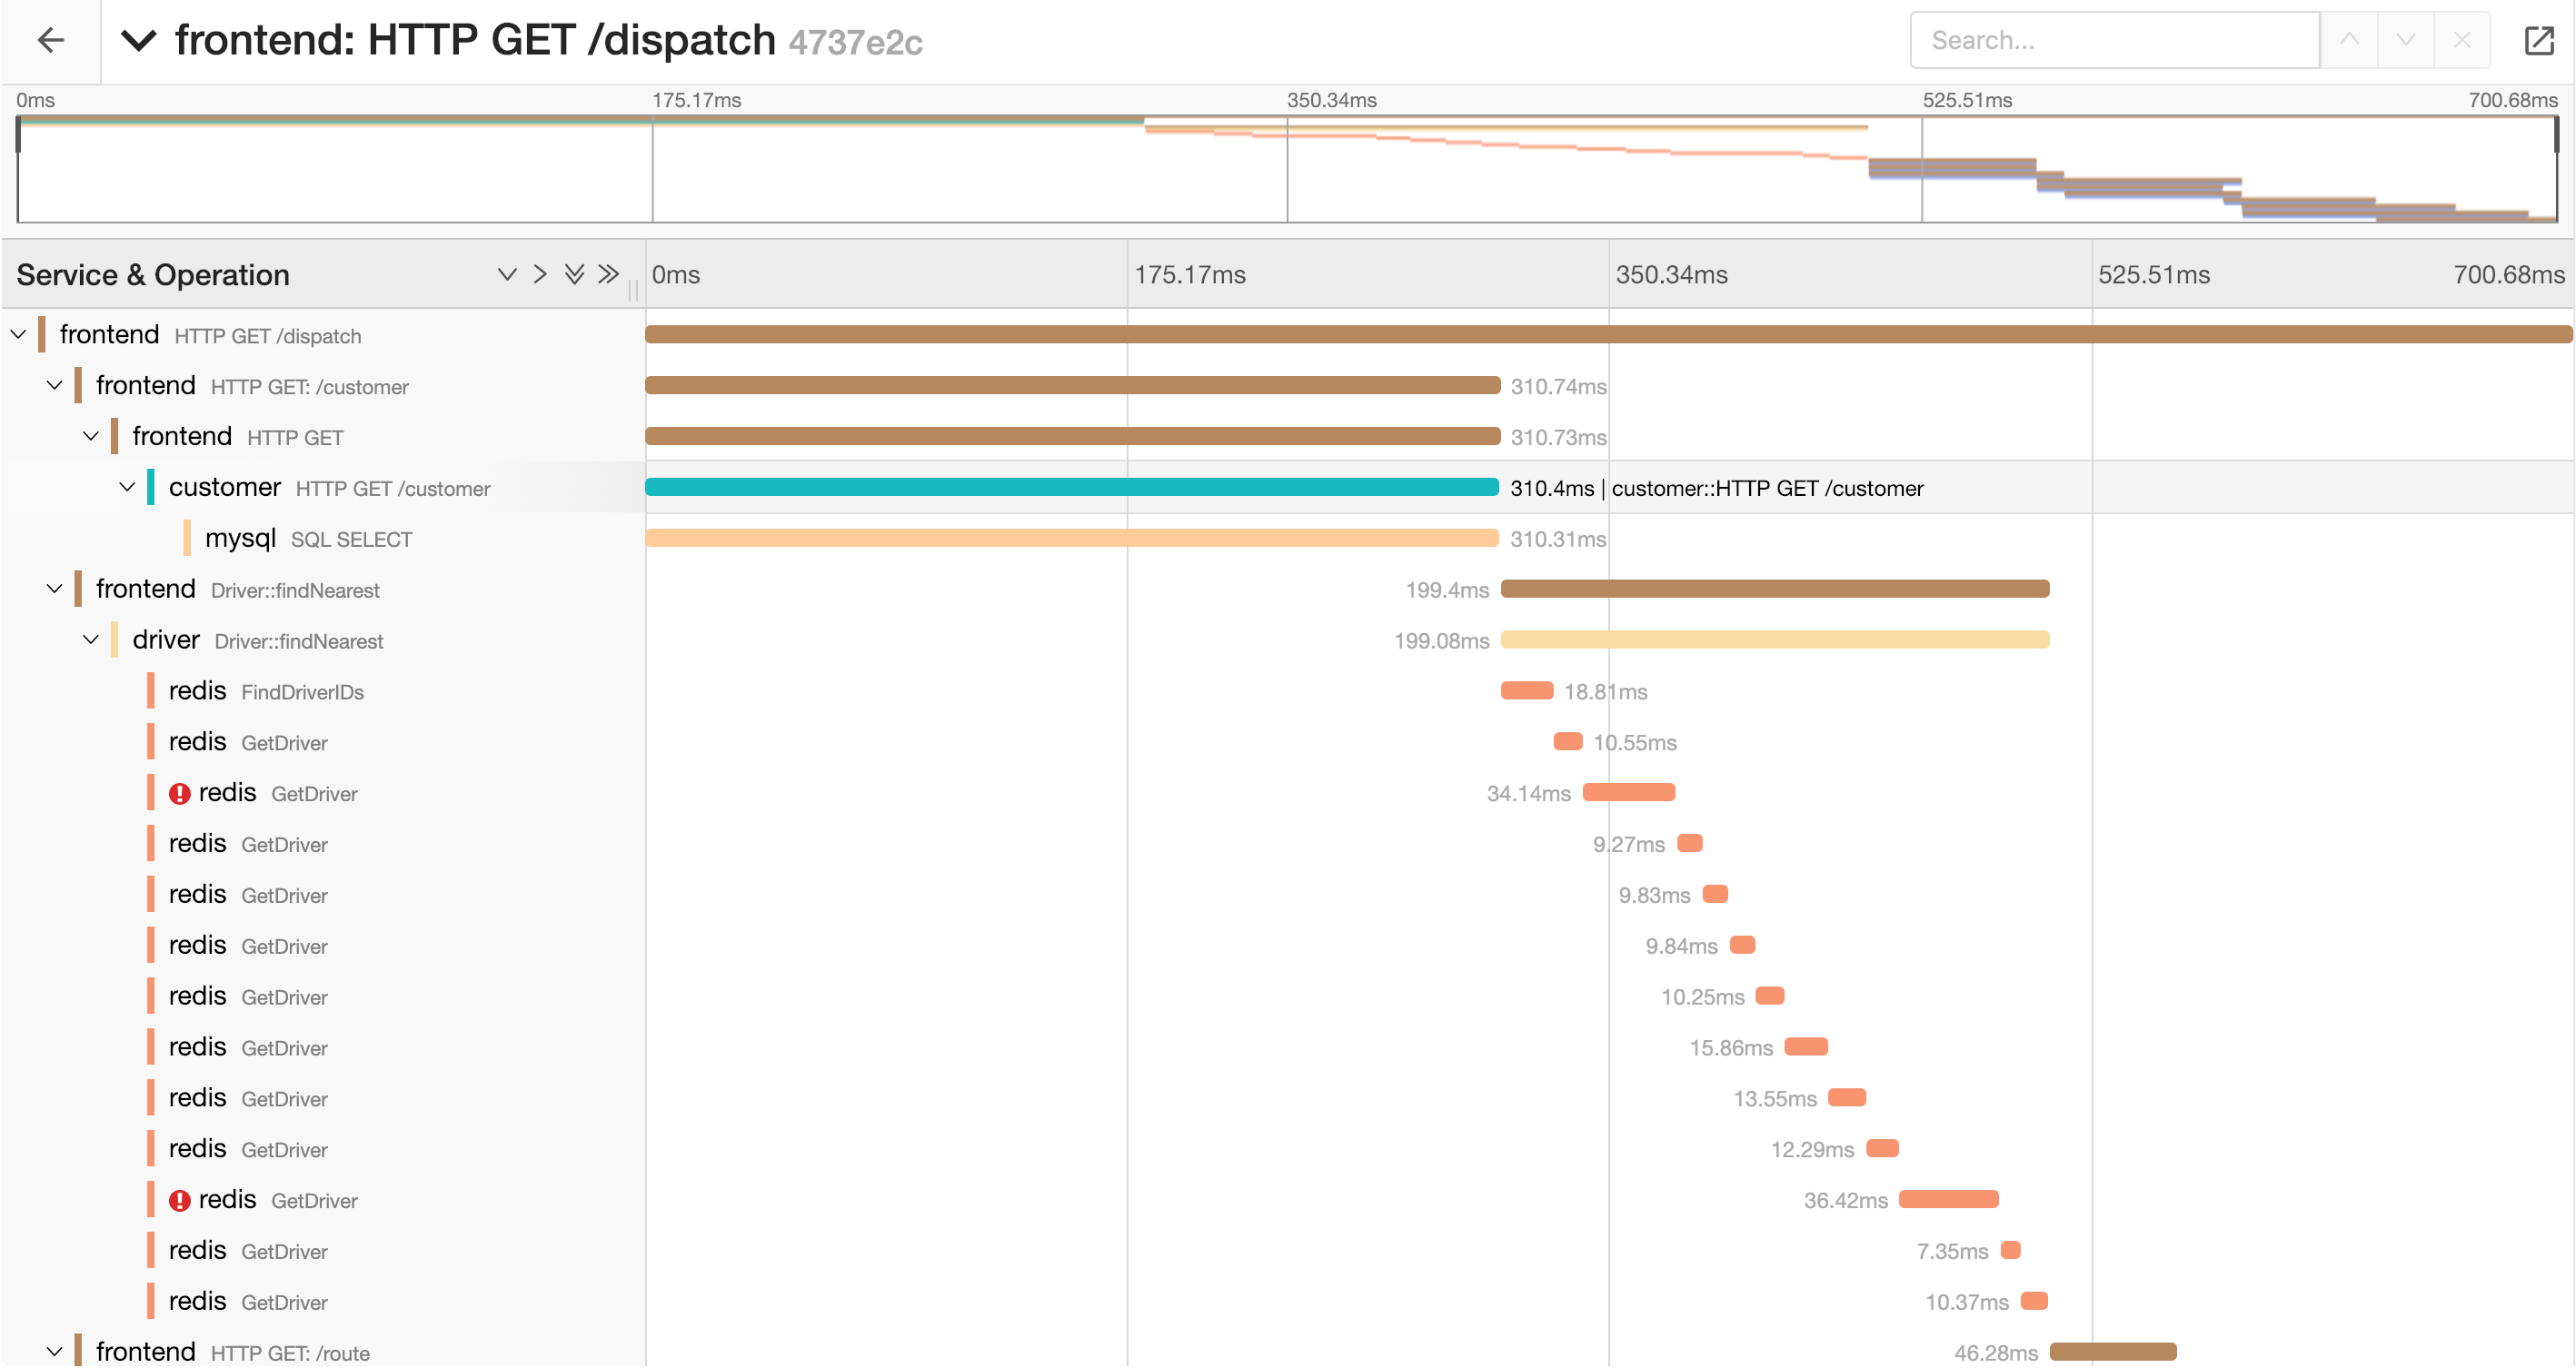
Embedded Mode
Starting with version 1.9, Jaeger UI provides an “embedded” layout mode which is intended to support integrating Jaeger UI into other applications. Currently (as of v0), the approach taken is to remove various UI elements from the page to make the UI better suited for space-constrained layouts.
The embedded mode is induced and configured via URL query parameters.
To enter embedded mode, the uiEmbed=v0 query parameter and value must be added to the URL. For example, the following URL will show the trace with ID abc123 in embedded mode:
http://localhost:16686/trace/abc123?uiEmbed=v0
uiEmbed=v0 is required.
Further, each page supported has an button added that will open the non-embedded page in a new tab.
The following pages support embedded mode:
- Search Page
- Trace Page
Search Page
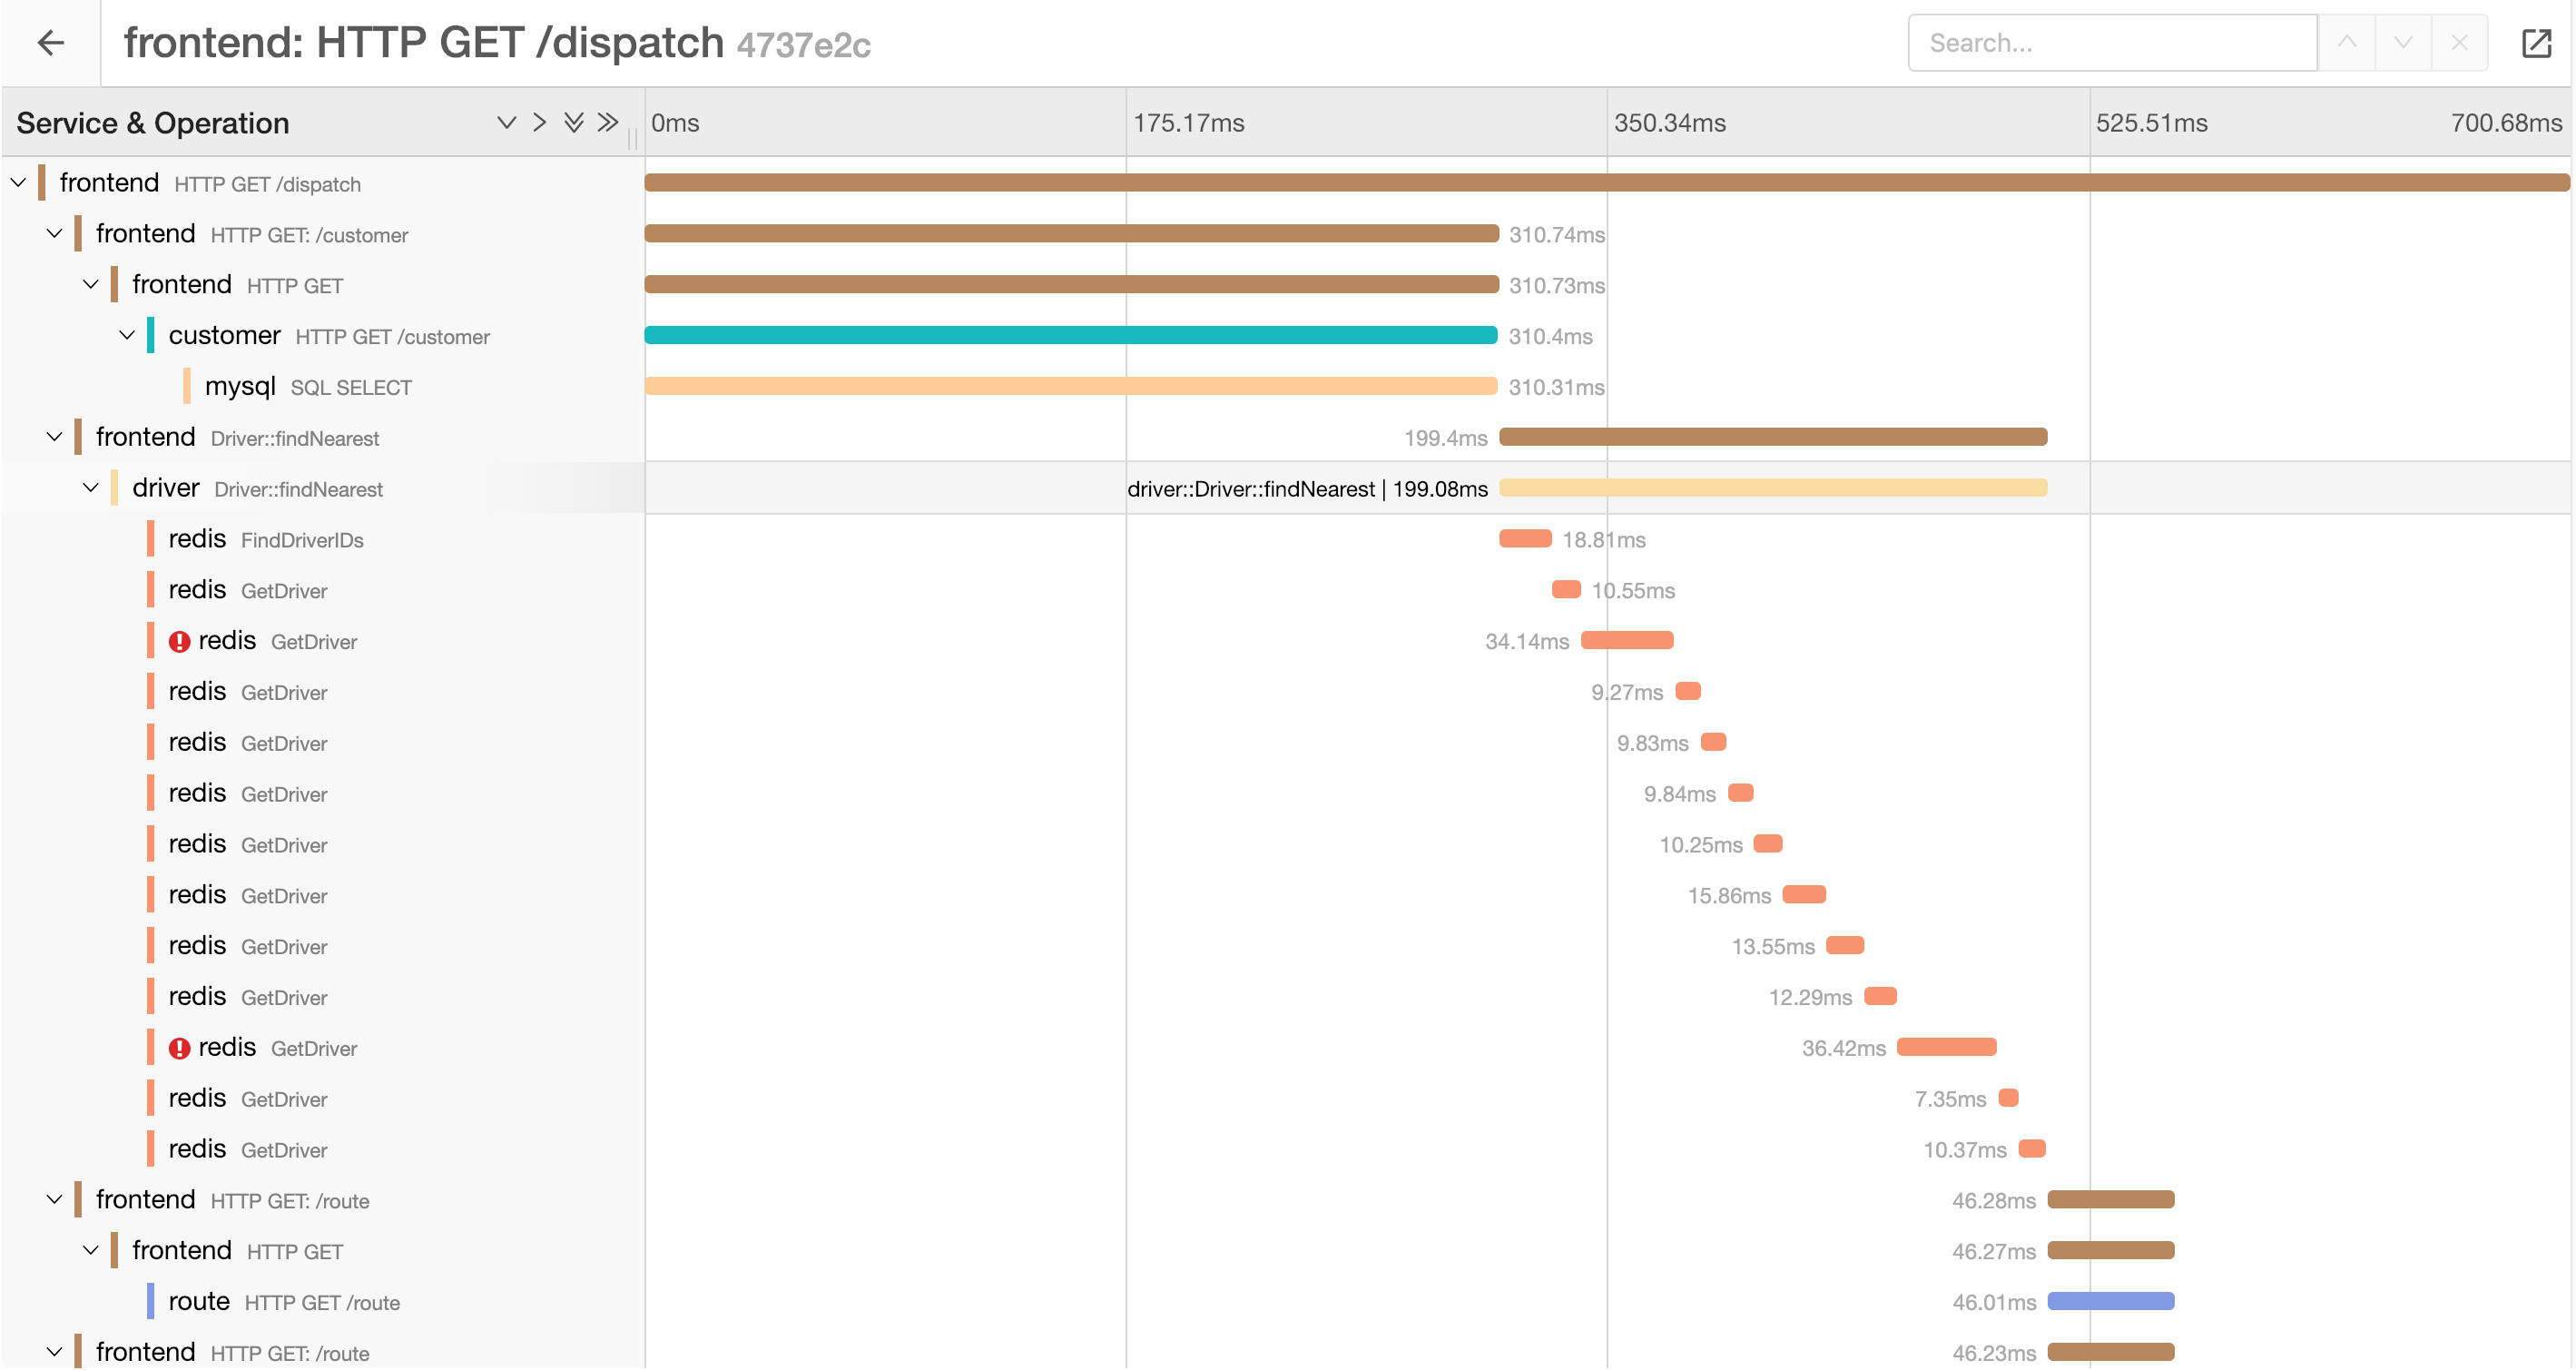
To integrate the Search Trace Page to our application we have to indicate to the Jaeger UI that we want to use the embed mode with uiEmbed=v0.
For example:
http://localhost:16686/search?
    service=my-service&
    start=1543917759557000&
    end=1543921359557000&
    limit=20&
    lookback=1h&
    maxDuration&
    minDuration&
    uiEmbed=v0
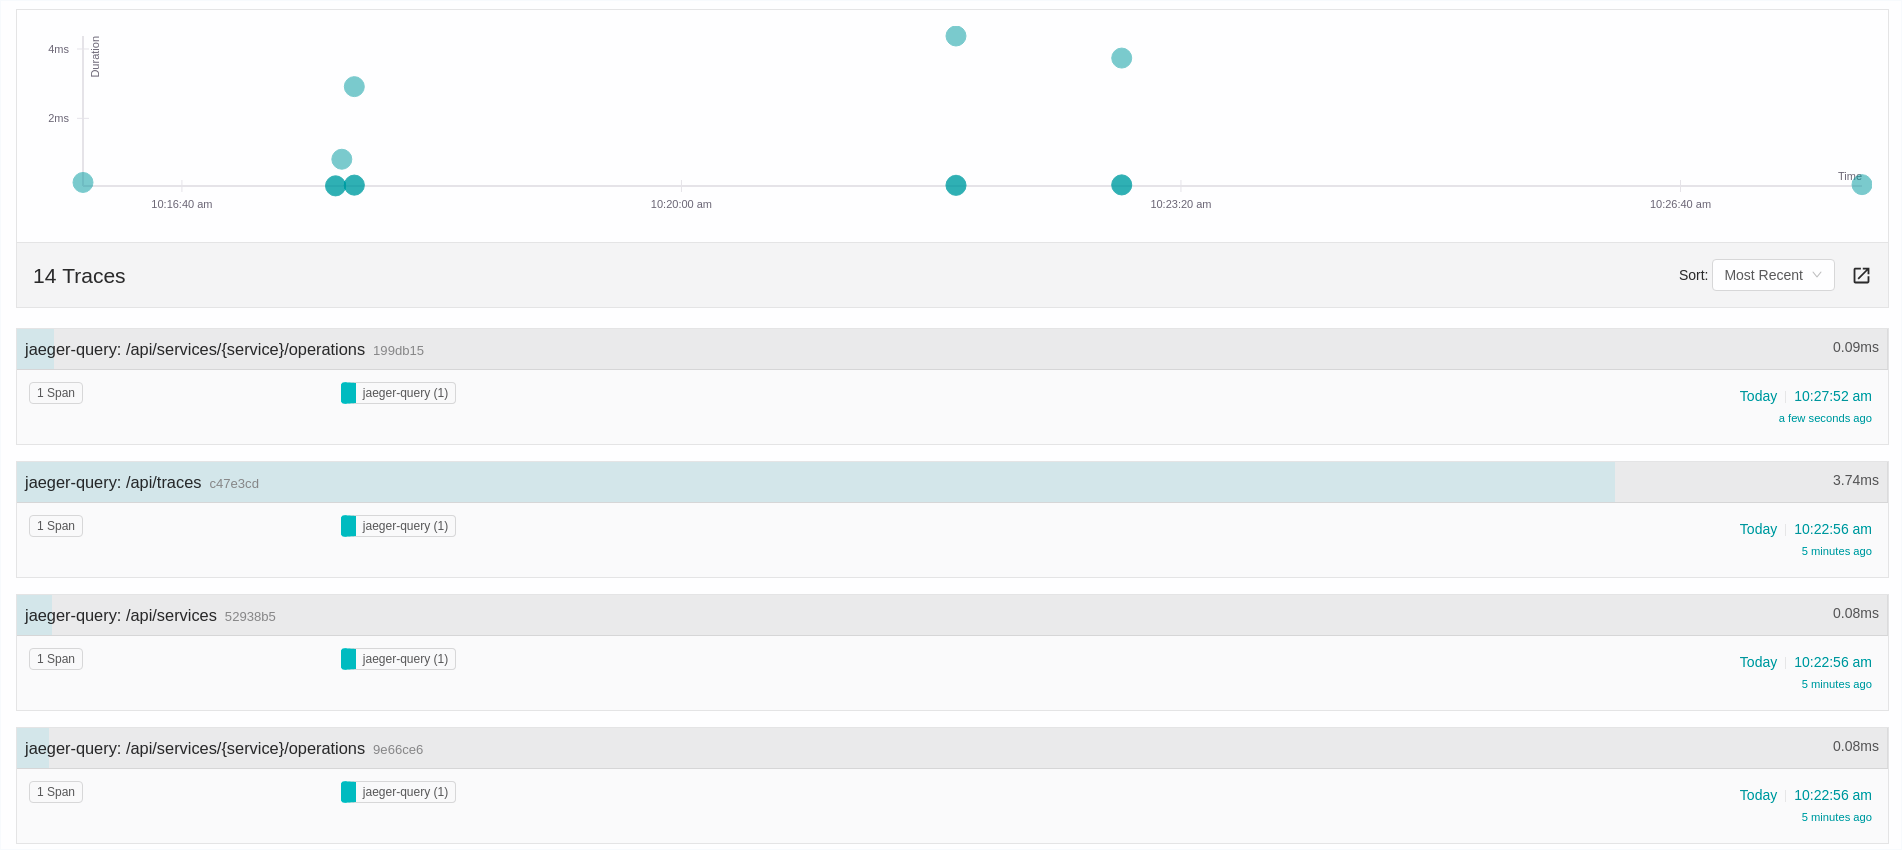
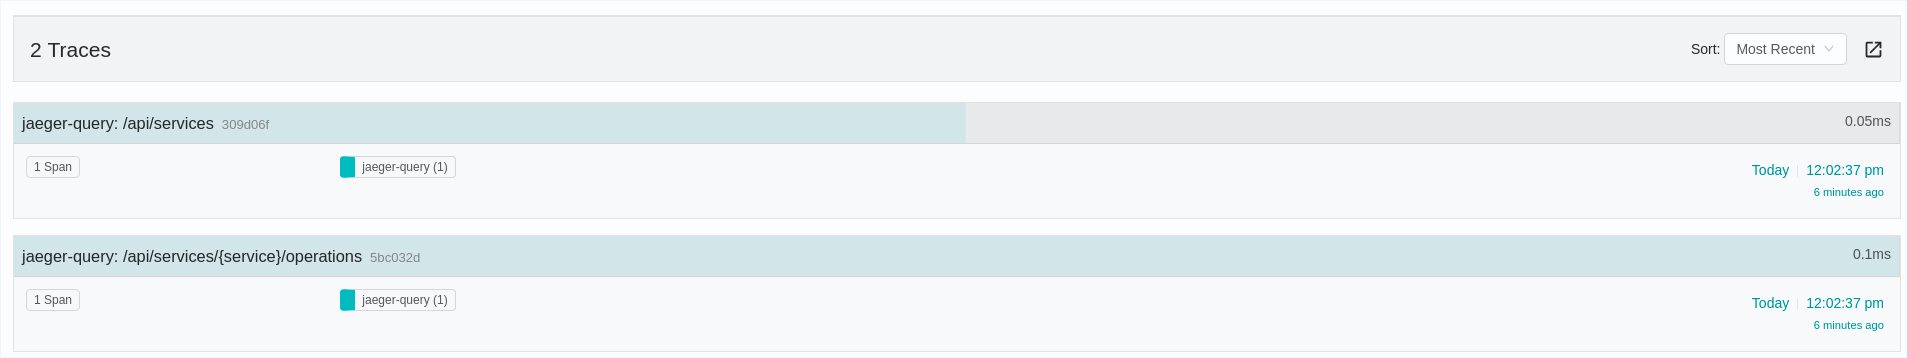
Configuration options
The following query parameter can be used to configure the layout of the search page :
uiSearchHideGraph=1- disables the display of the scatter plot above the search results
http://localhost:16686/search?
    service=my-service&
    start=1543917759557000&
    end=1543921359557000&
    limit=20&
    lookback=1h&
    maxDuration&
    minDuration&
    uiEmbed=v0&
    uiSearchHideGraph=1
Trace Page
To integrate the Trace Page to our application we have to indicate to the Jaeger UI that we want to use the embed mode with uiEmbed=v0.
For example:
http://localhost:16686/trace/{trace-id}?uiEmbed=v0
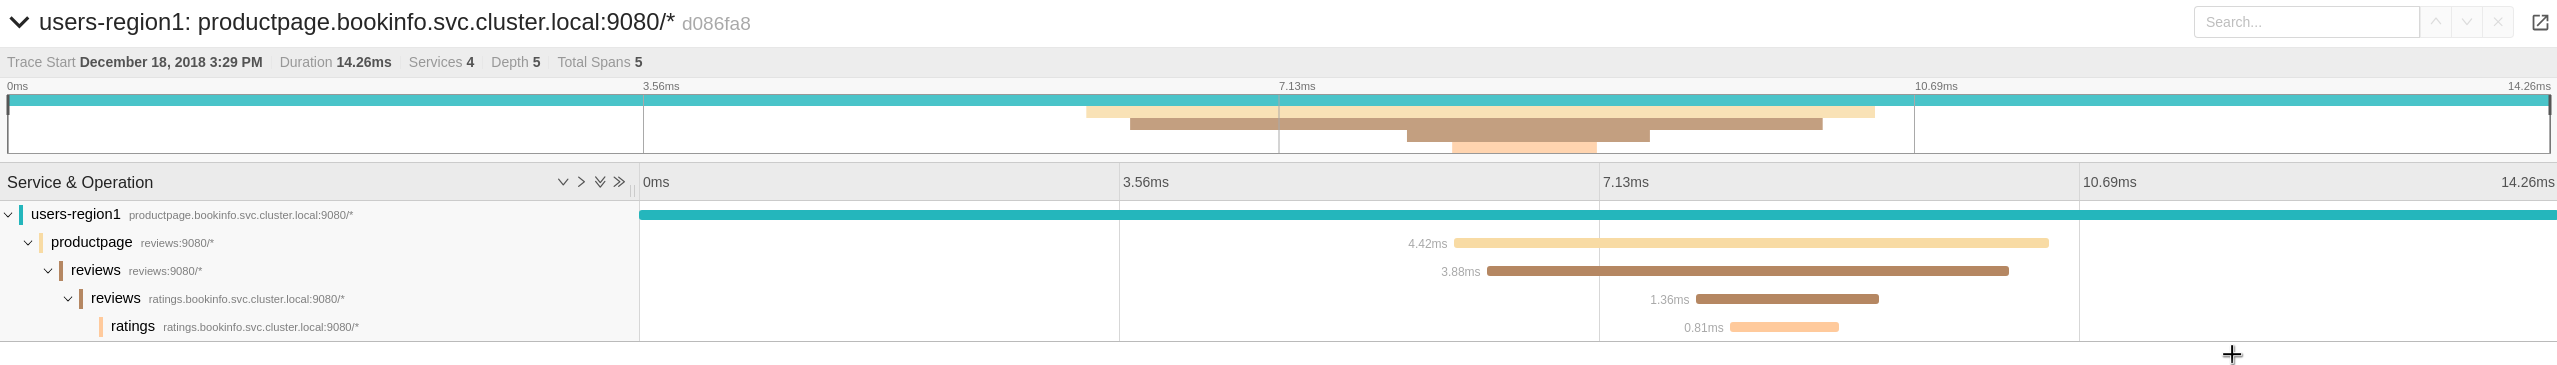
If we have navigated to this view from the search traces page we’ll have a button to go back to the results page.
Configuration options
The following query parameters can be used to configure the layout of the trace page :
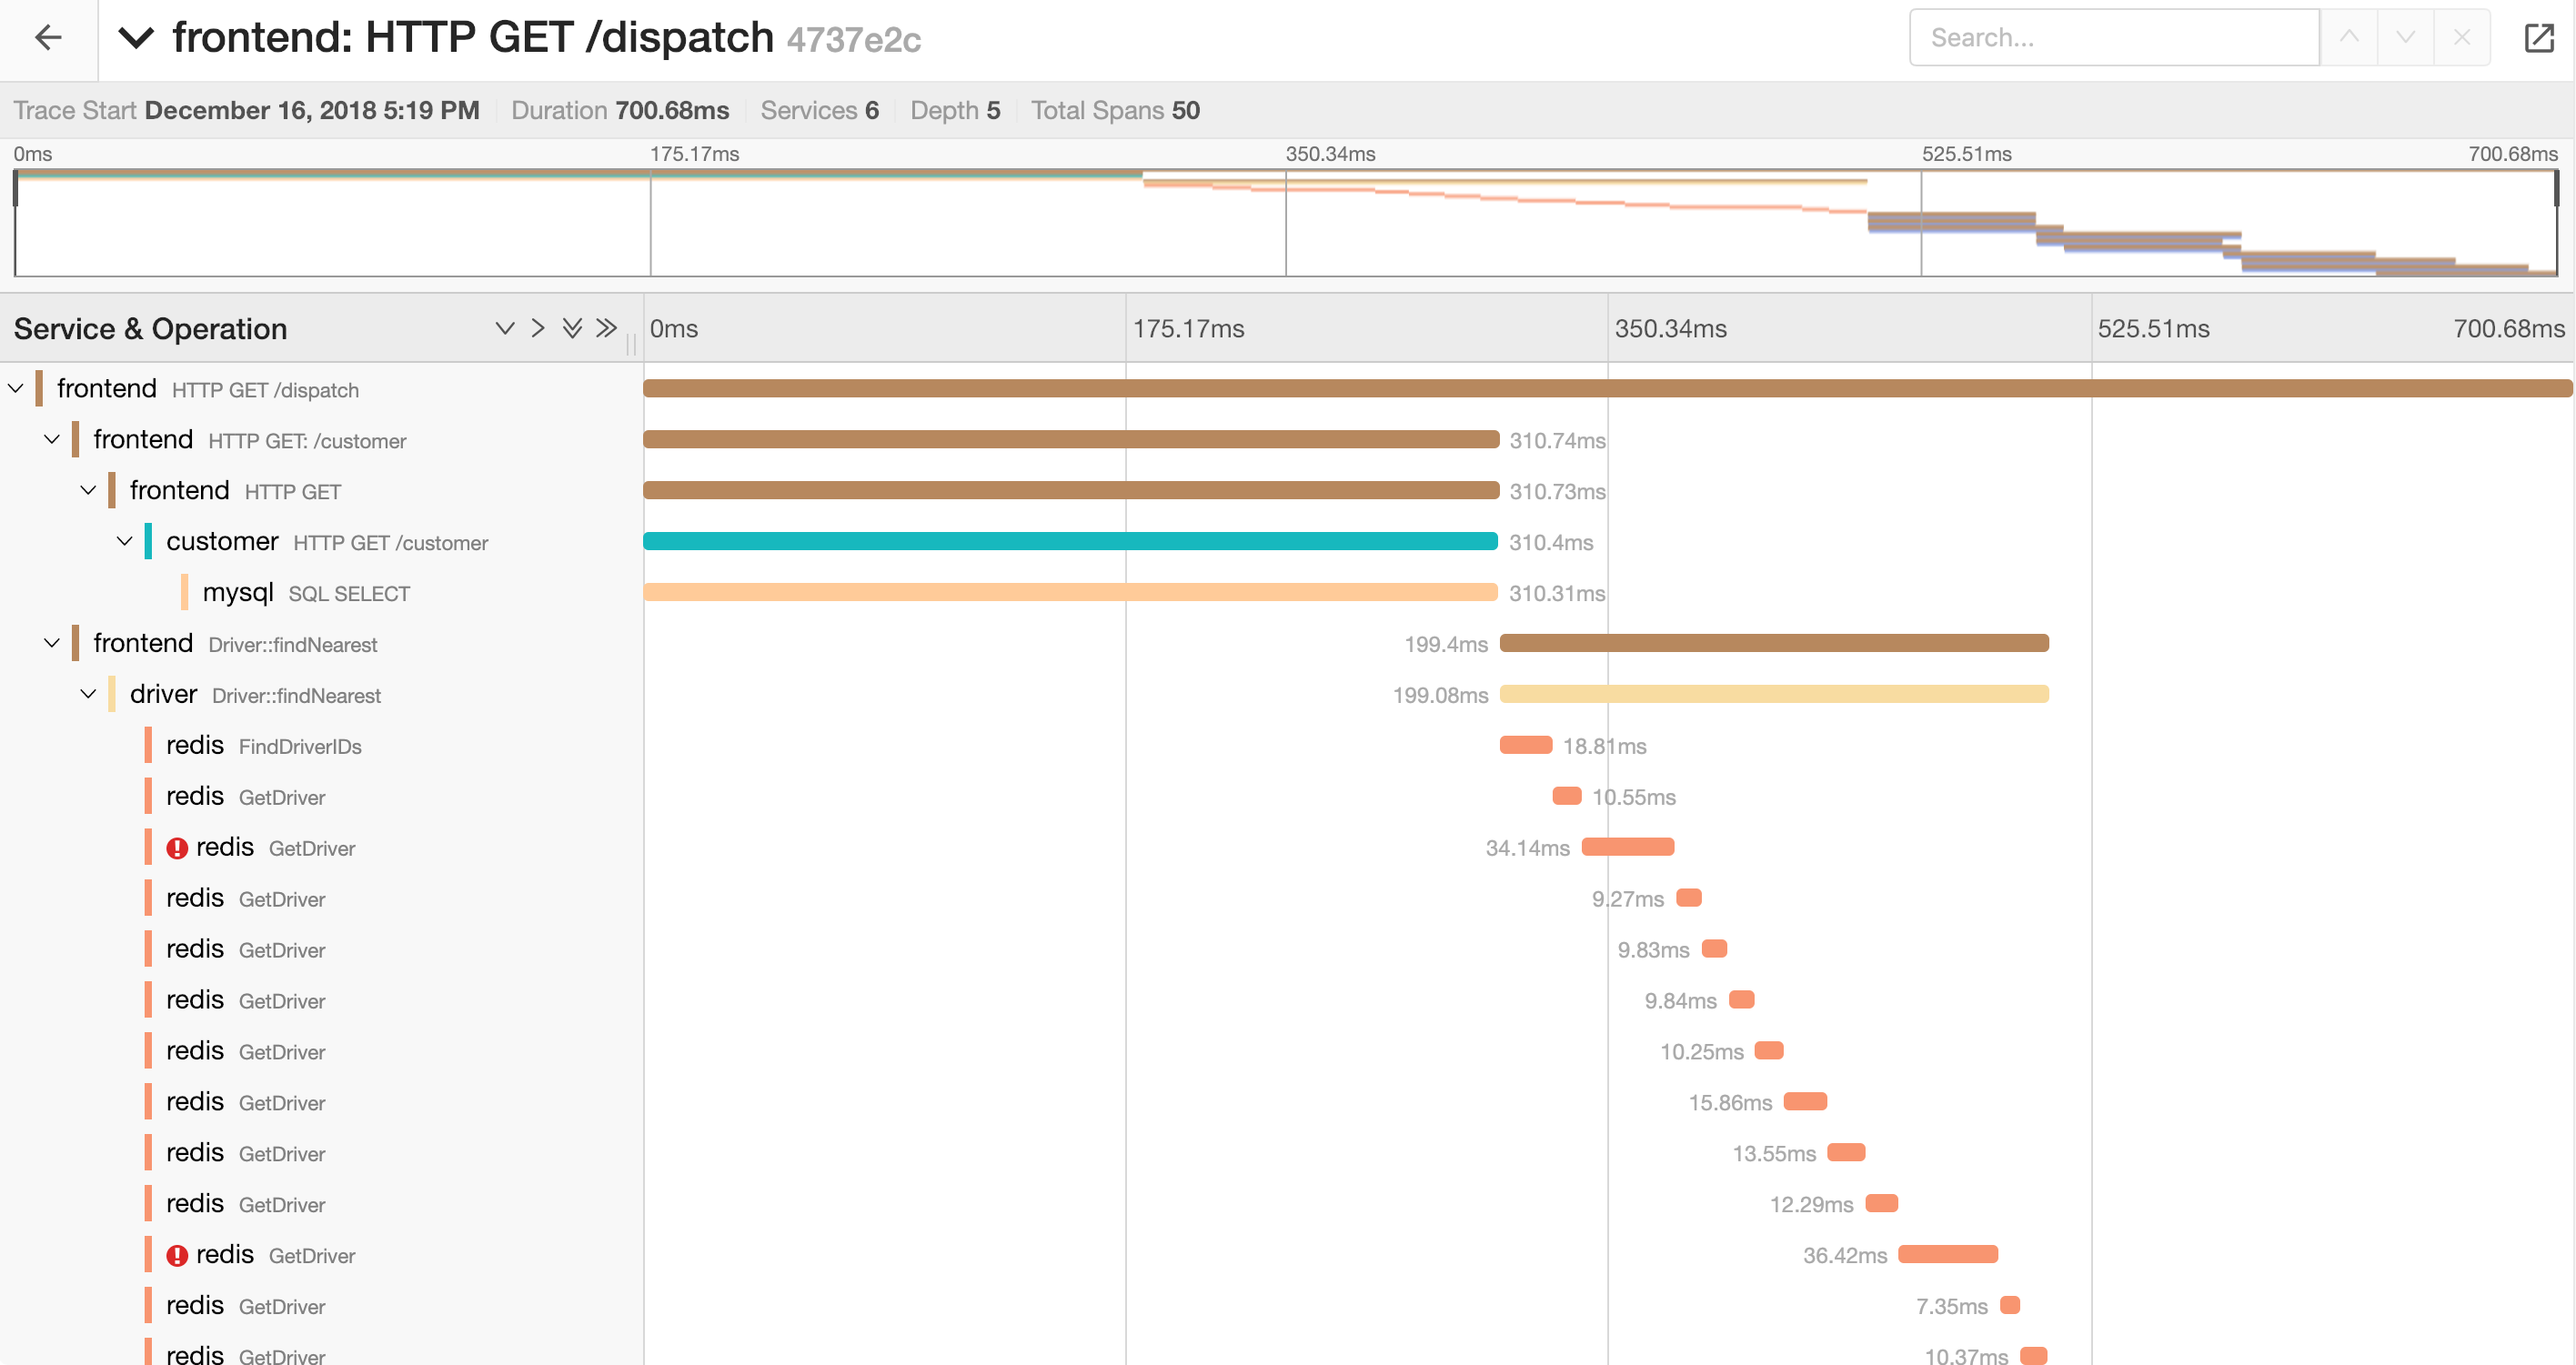
uiTimelineCollapseTitle=1causes the trace header to start out collapsed, which hides the summary and the minimap.
http://localhost:16686/trace/{trace-id}?
    uiEmbed=v0&
    uiTimelineCollapseTitle=1
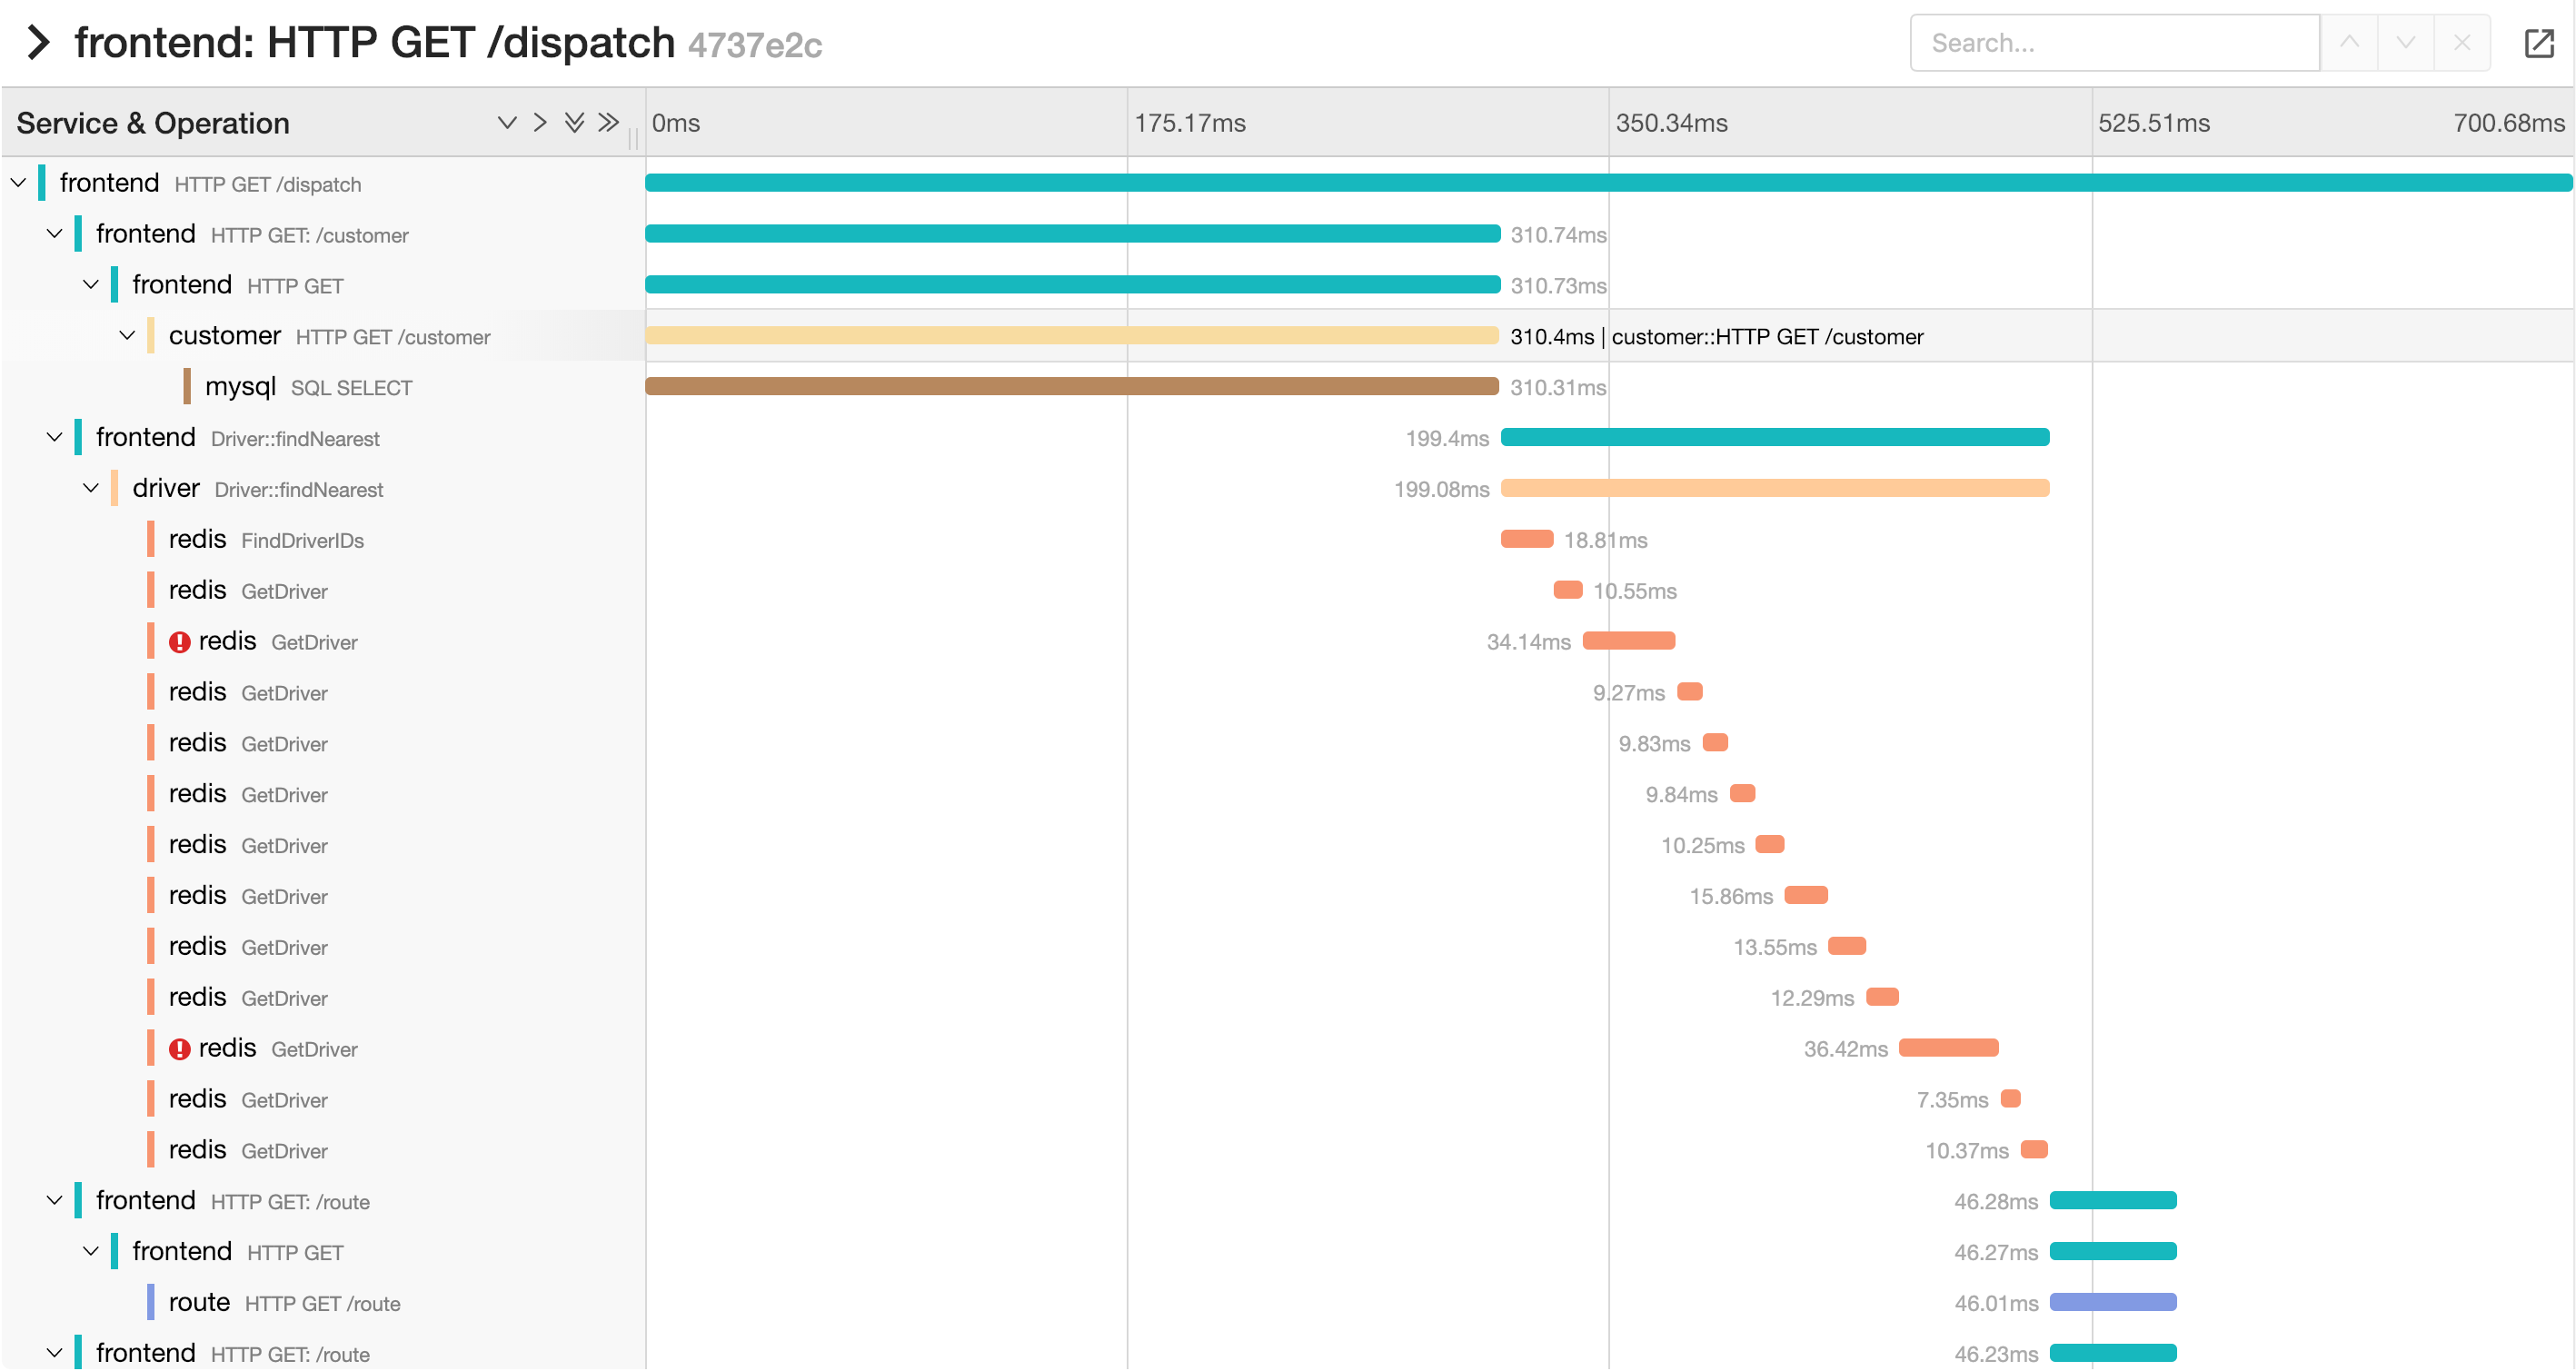
uiTimelineHideMinimap=1removes the minimap, entirely, regardless of whether the trace header is expanded or not.
http://localhost:16686/trace/{trace-id}?
    uiEmbed=v0&
    uiTimelineHideMinimap=1
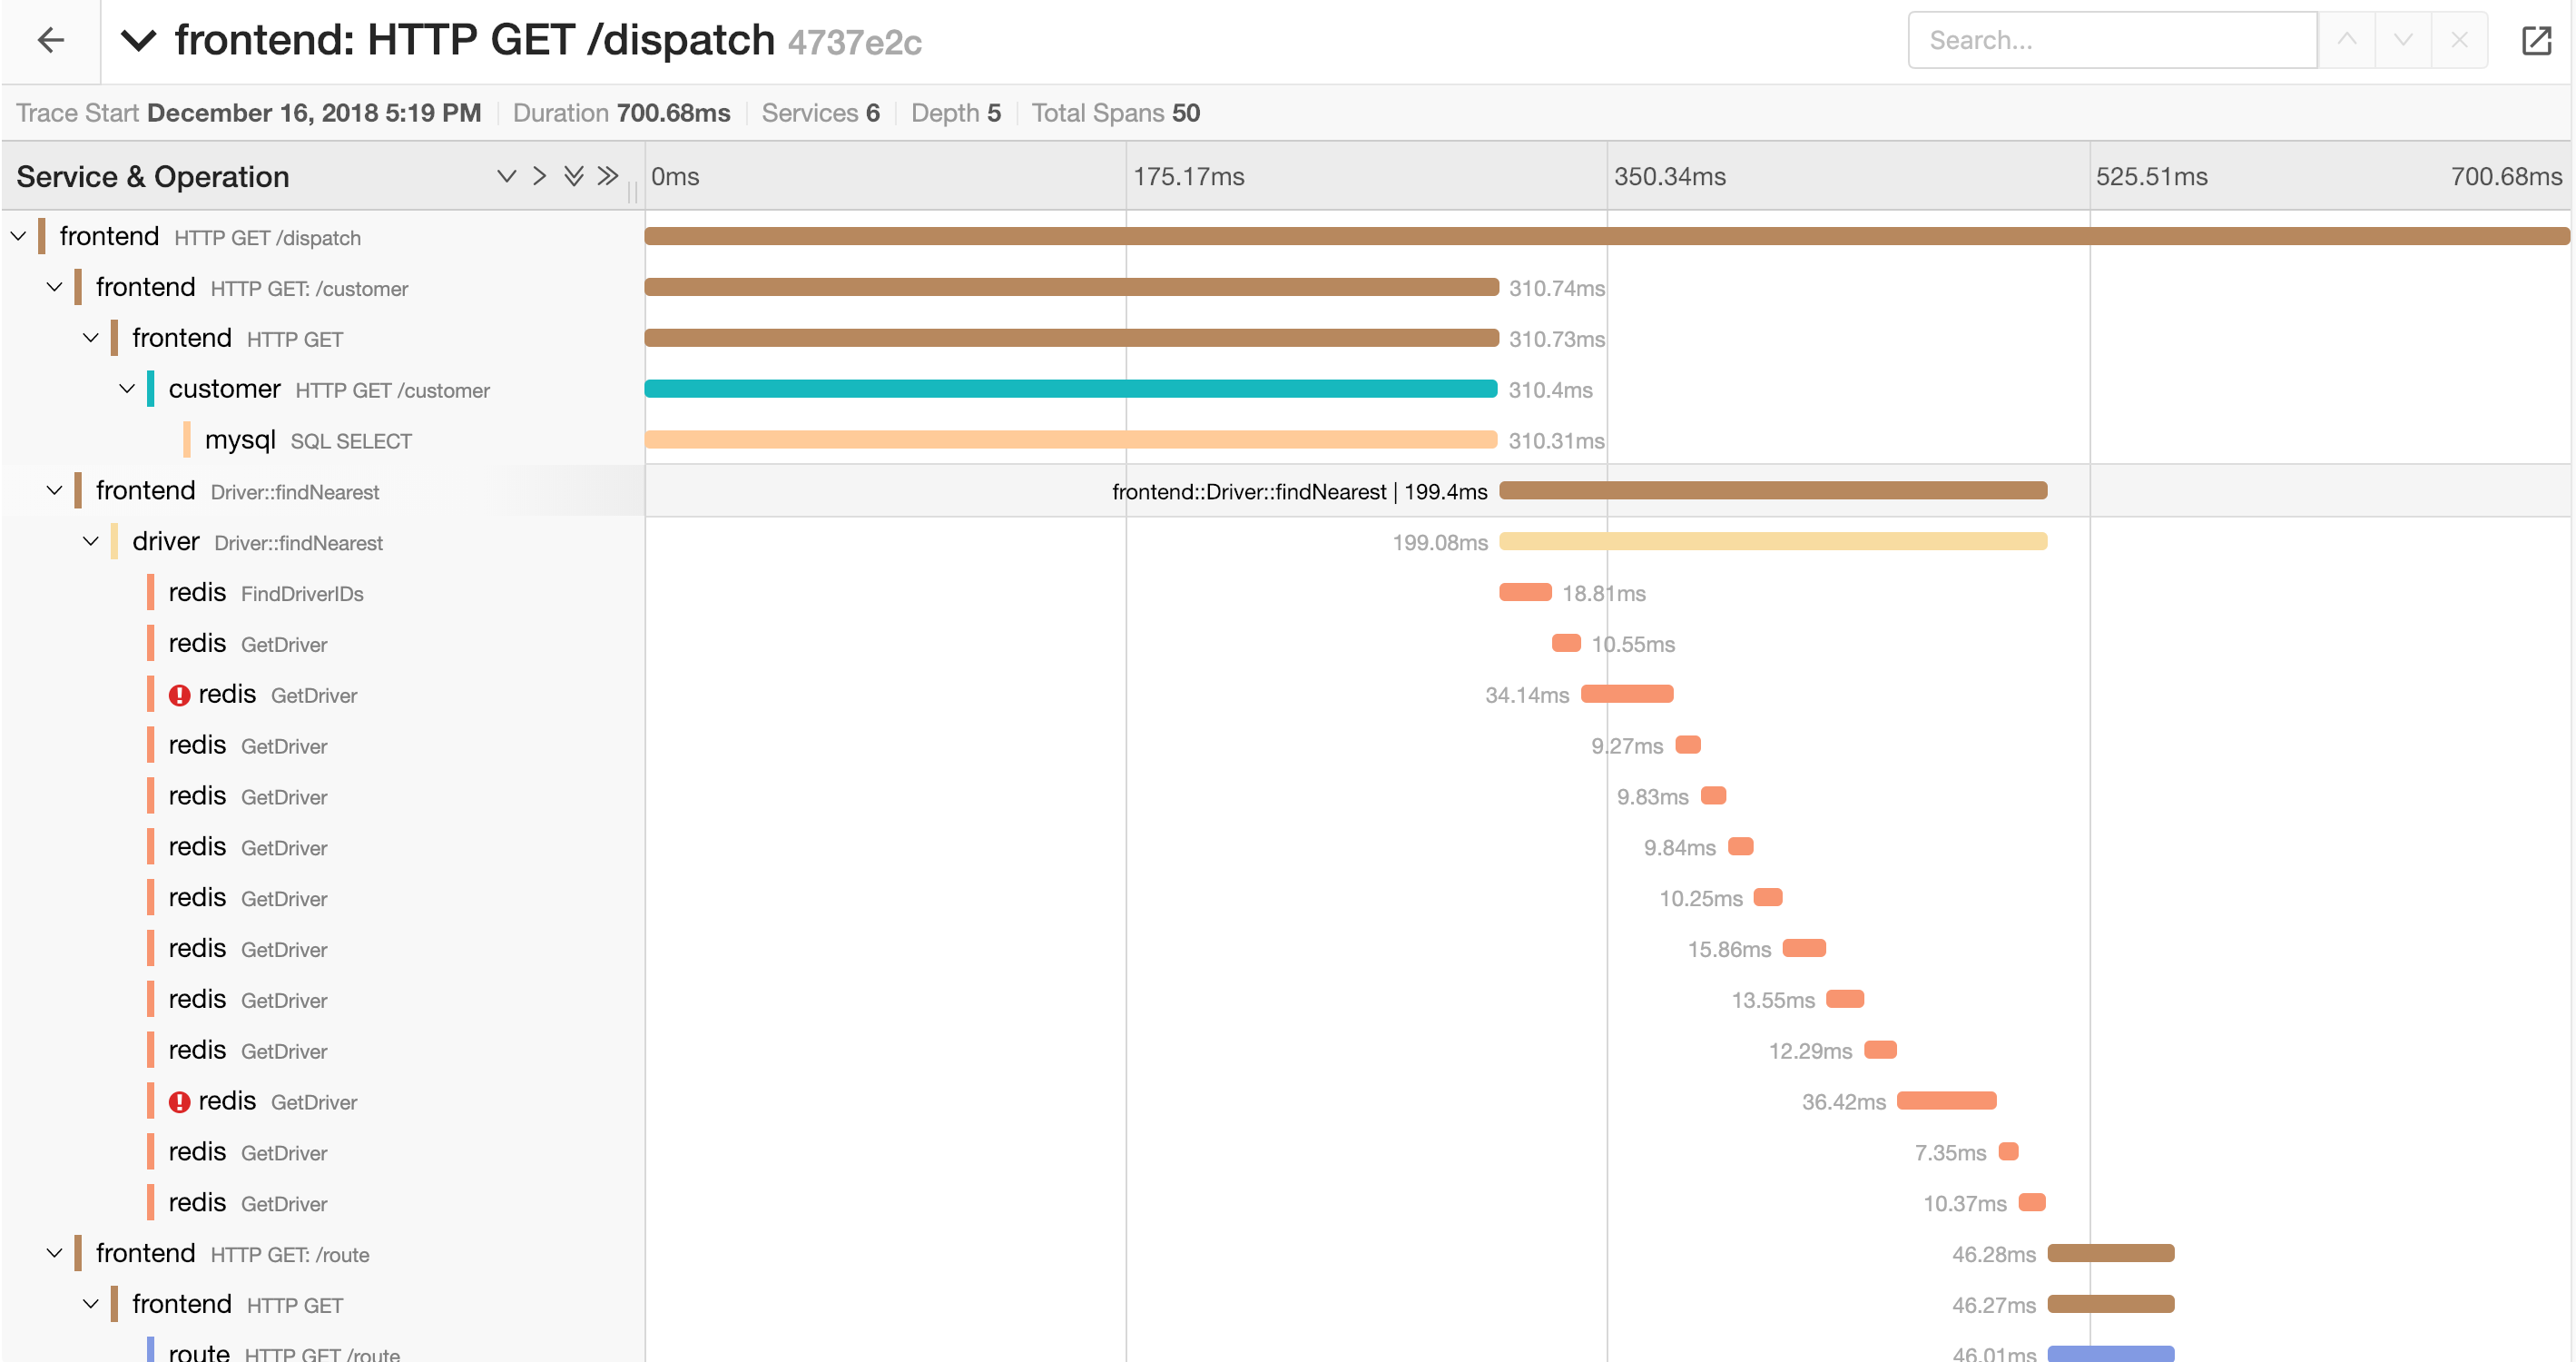
uiTimelineHideSummary=1- removes the trace summary information (number of services, etc.) entirely, regardless of whether the trace header is expanded or not.
http://localhost:16686/trace/{trace-id}?
    uiEmbed=v0&
    uiTimelineHideSummary=1
We can also combine the options:
http://localhost:16686/trace/{trace-id}?
    uiEmbed=v0&
    uiTimelineHideMinimap=1&
    uiTimelineHideSummary=1