Features
High Scalability
Jaeger backend is designed to have no single points of failure and to scale with the business needs. For example, Jaeger installation at Uber is typically processing several billion spans per day.
Cloud Native
Jaeger backend is distributed as a container image or a raw binary, available for multiple platforms. The behavior of the binary can be customized via YAML configuration file. Deployment to Kubernetes clusters is assisted by a Kubernetes operator and a Helm chart.
OpenTelemetry
Jaeger receives trace data in the standard OpenTelemetry Protocol (OTLP), and the Web UI presents it in OpenTelemetry terms. Traces are directed acyclic graphs, not just trees, through span links, and spans carry strongly typed attributes and structured events. The Terminology page maps the OpenTelemetry names to the ones that Jaeger’s legacy formats use.
Multiple storage backends
Jaeger can be used with a growing number of storage backends:
- It natively supports popular open source NoSQL databases as trace storage backends: Cassandra 4.0+, Elasticsearch 7.x/8.x, and OpenSearch 1.0+.
- It is extensible via the Remote Storage API with other well known databases that have been certified to be Jaeger compliant: ClickHouse.
- There is embedded database support using Badger and simple in-memory storage for testing setups.
- There are ongoing community experiments using other databases; you can find more in this issue.
Sampling
To control the overhead on the applications and the storage costs, Jaeger supports multiple forms of sampling: head-based with centralized remote configuration (static or adaptive) and tail-based sampling. For more information, please refer to the Sampling page.
Modern Web UI
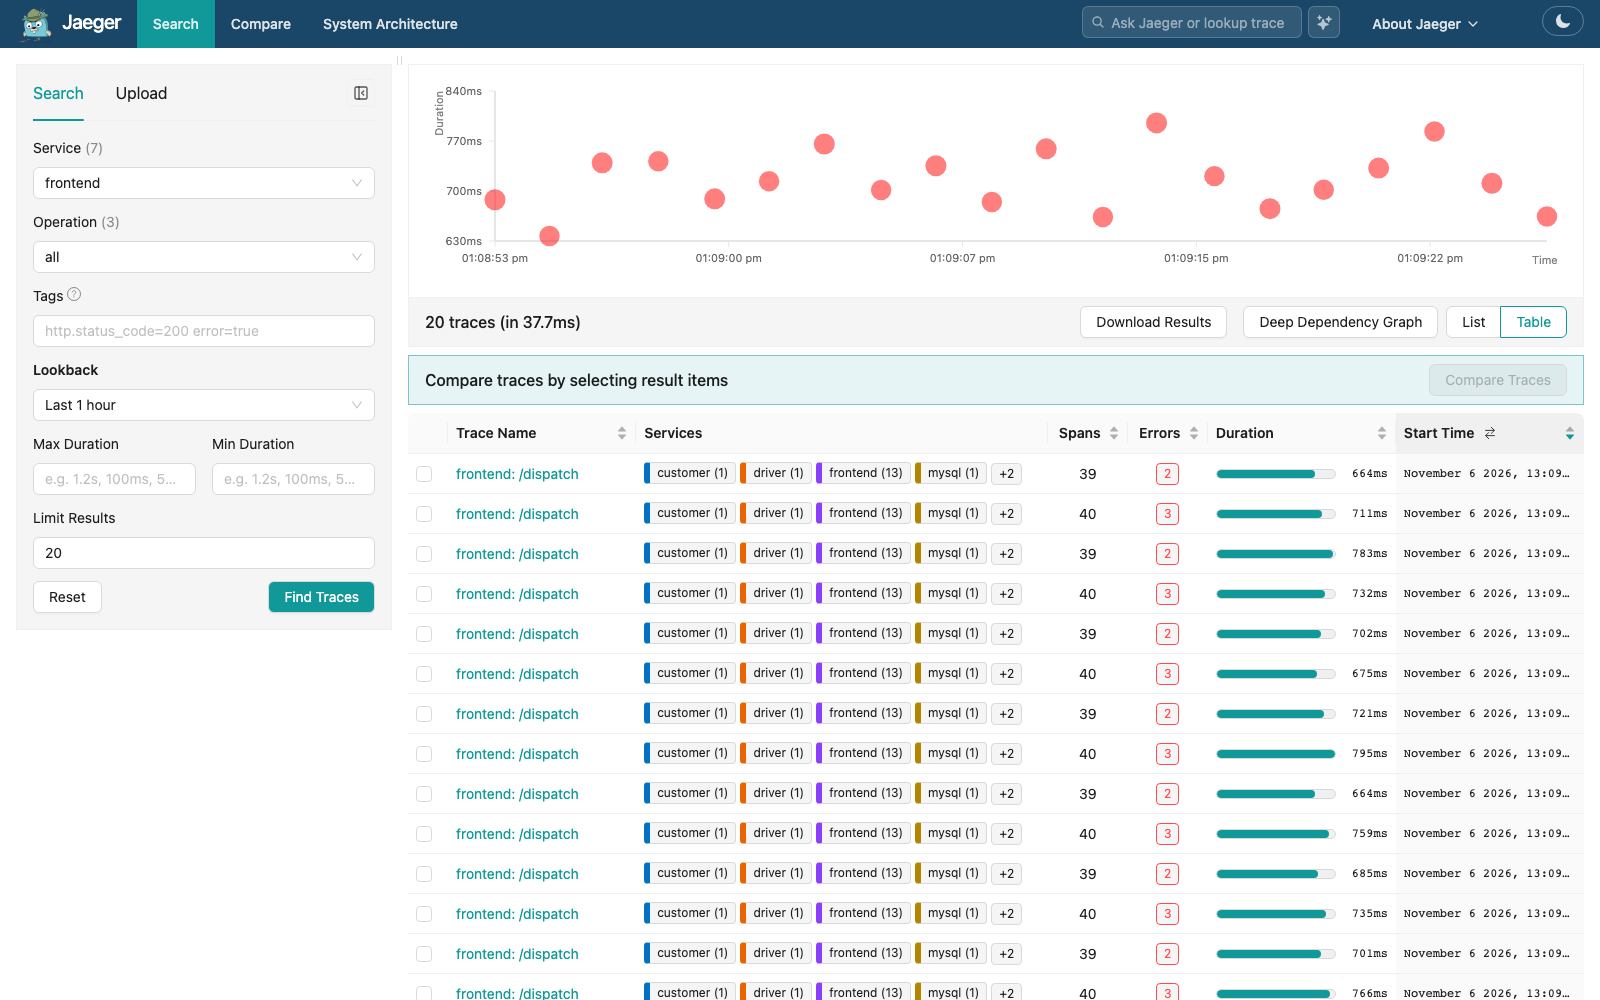
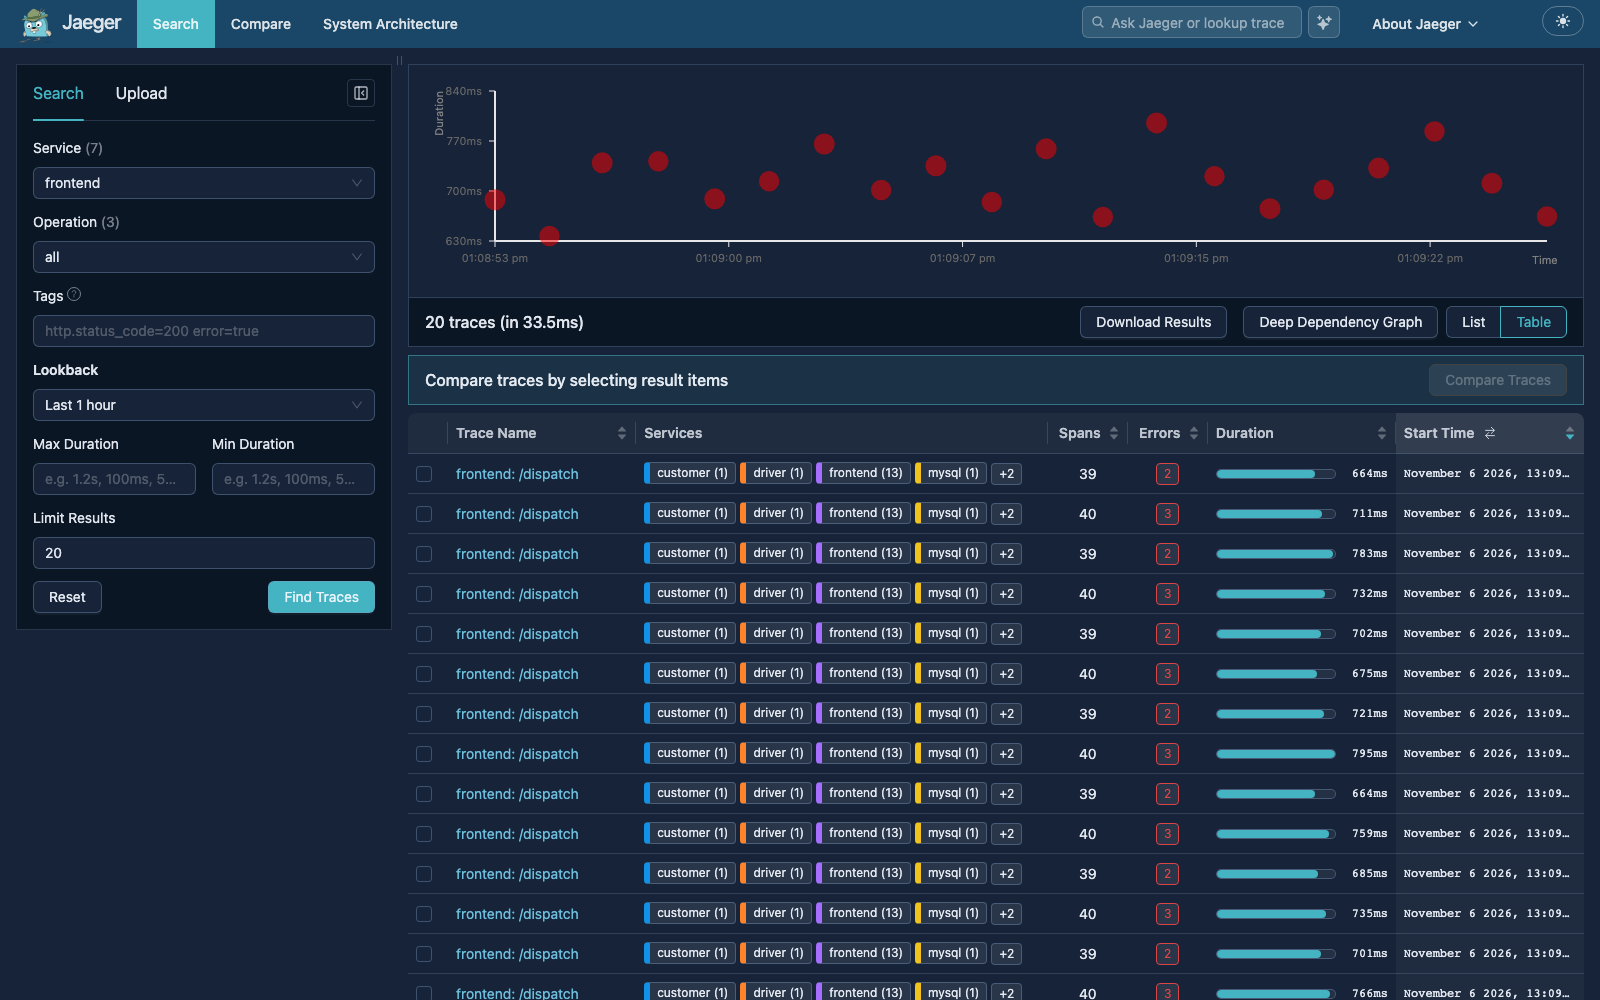
Jaeger Web UI is implemented in Javascript as a React application. Several performance improvements have been released in v1.0 to allow the UI to efficiently deal with large volumes of data and display traces with tens of thousands of spans (e.g. we tried a trace with 80,000 spans).
Trace View
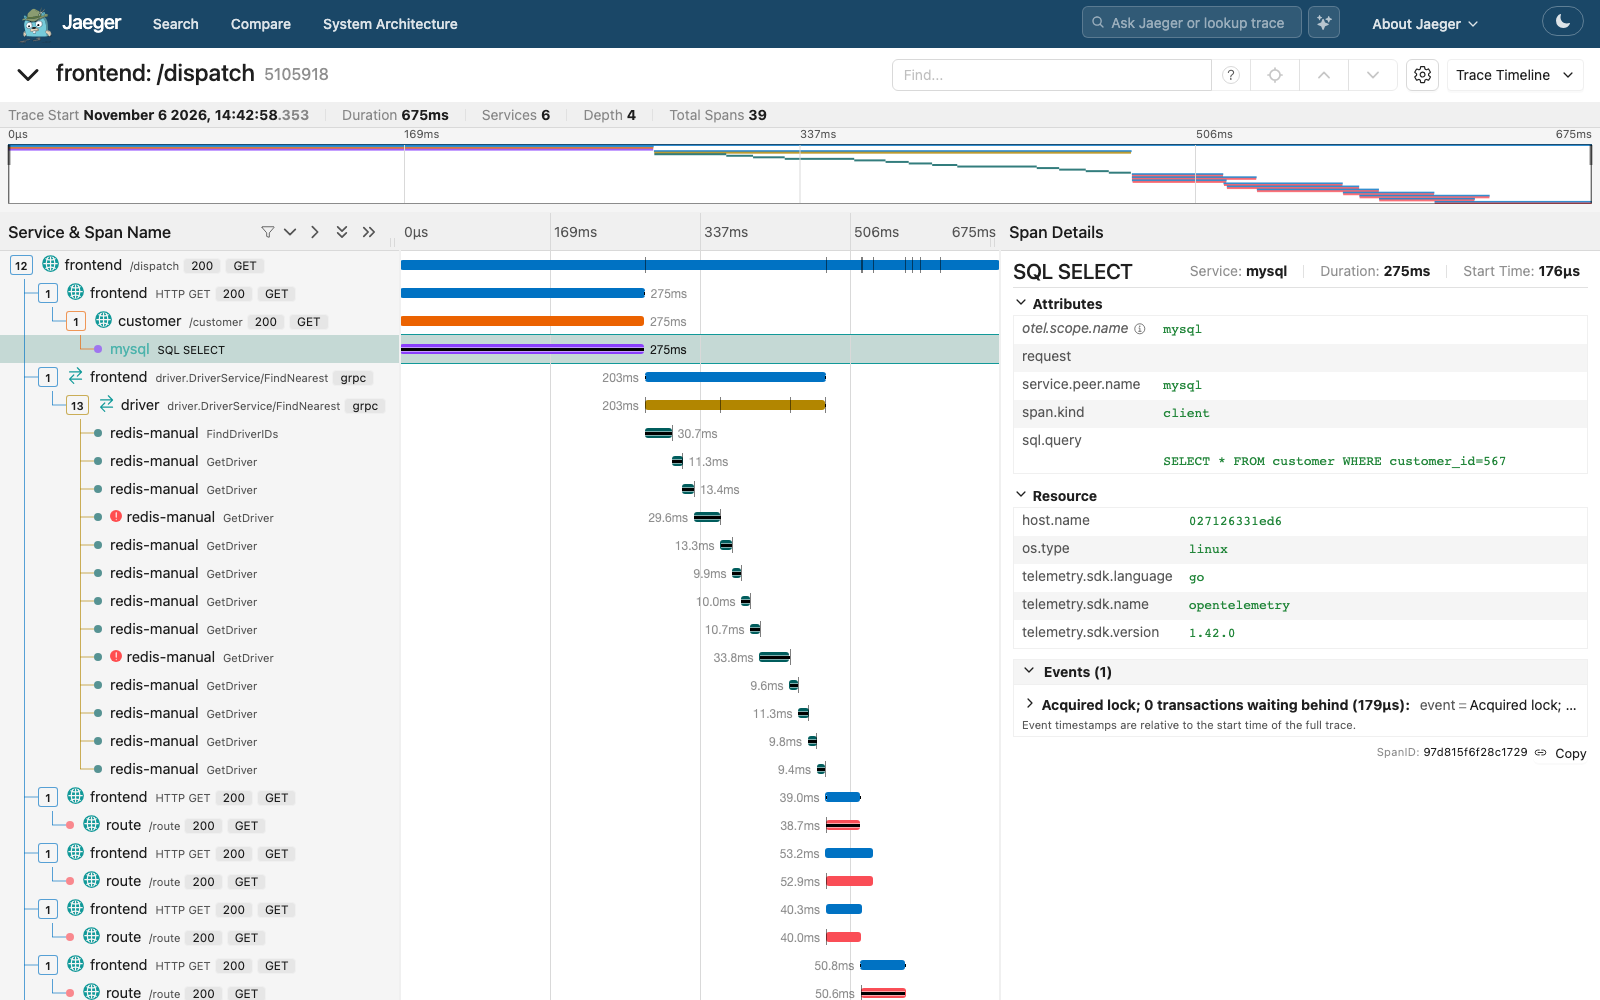
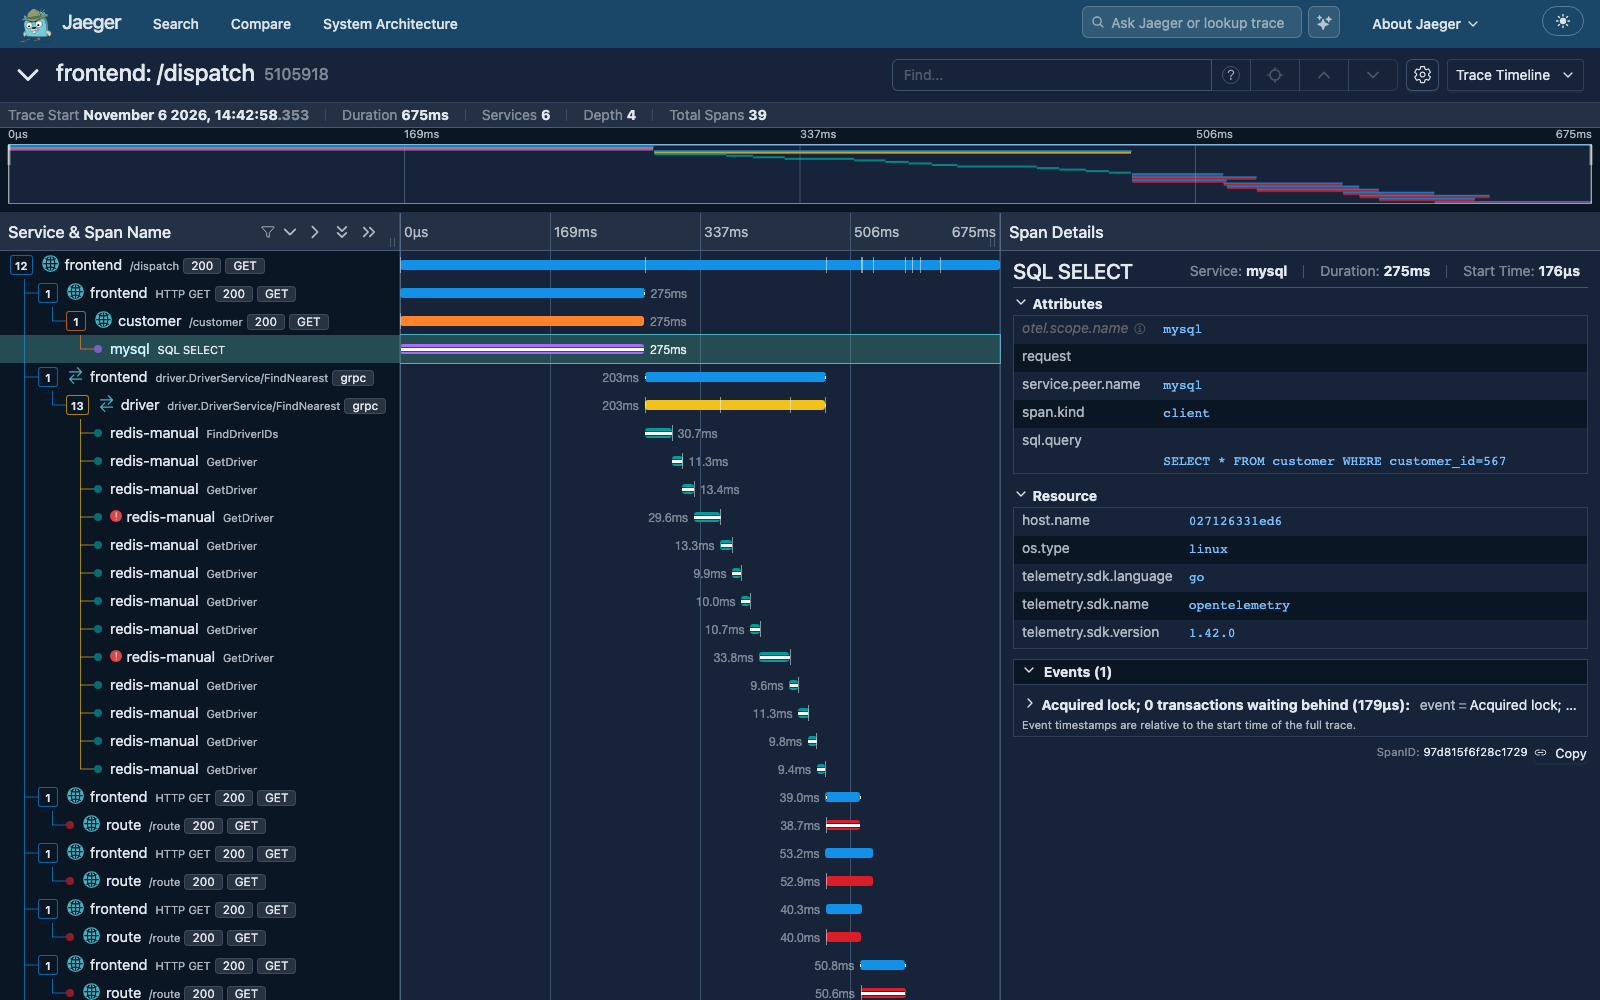
The trace view shows the spans of one trace as a Gantt chart. Selecting a span shows its details in a side panel. Other views of the same trace show it as a graph, a flame graph, a statistics table or JSON.
Observability
All Jaeger backend components expose Prometheus metrics by default. Logs are written to stdout using the structured logging library zap.
Topology Graphs
Jaeger UI supports two types of service graphs: System Architecture and Deep Dependency Graph.
System Architecture
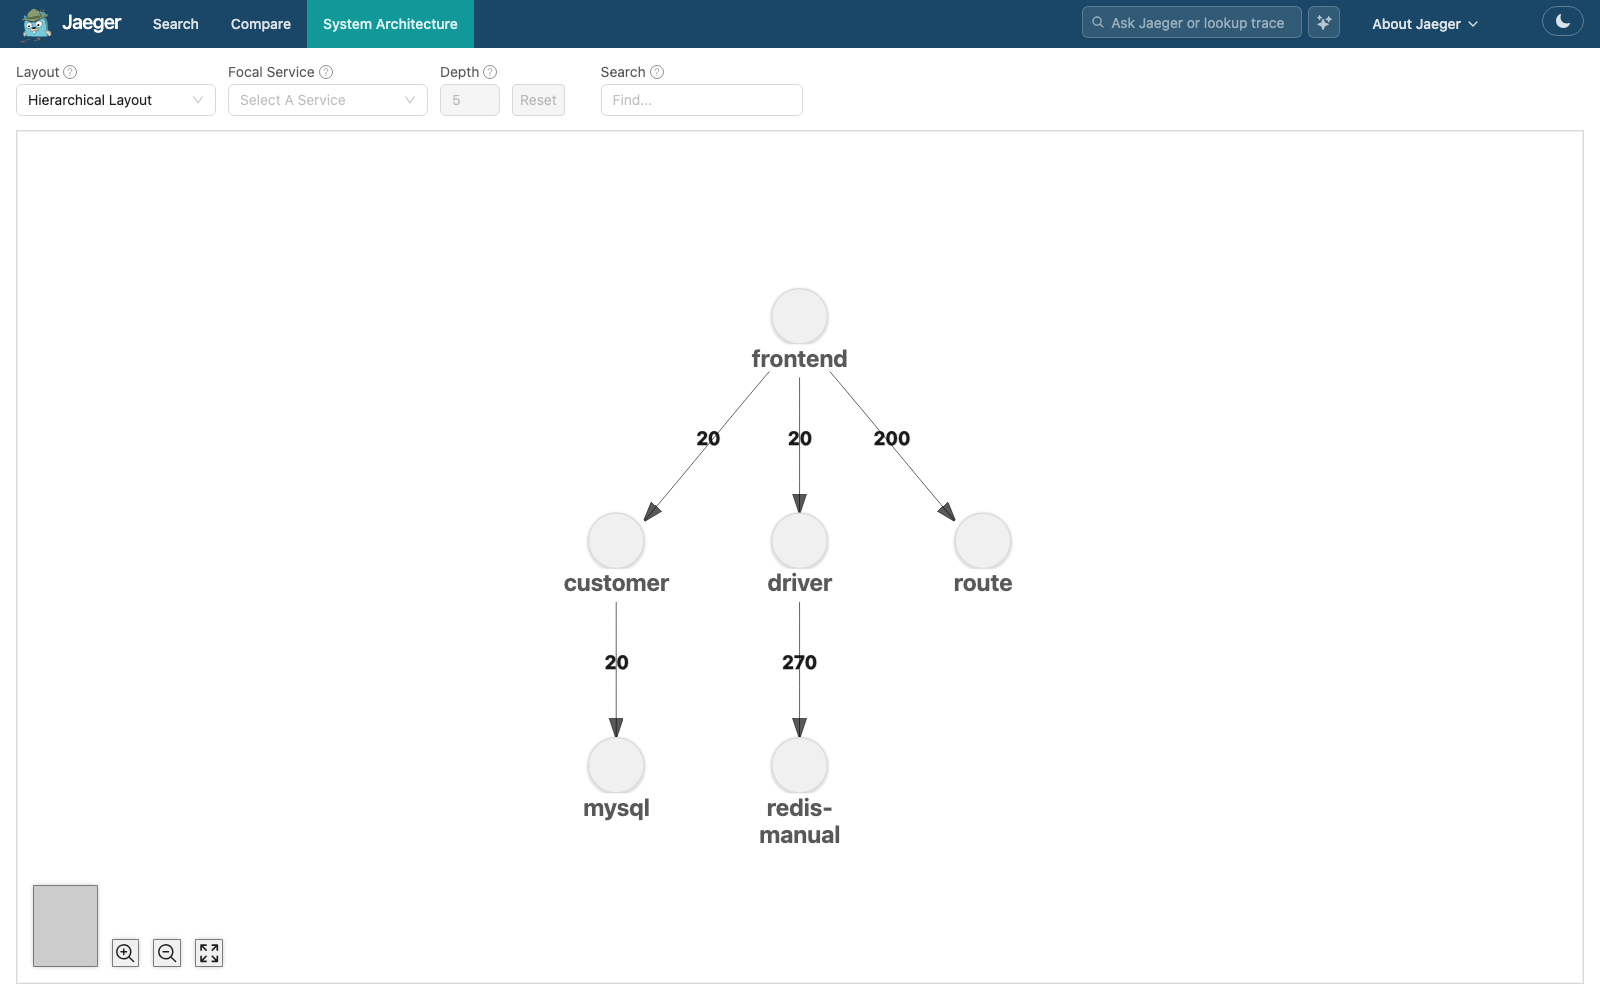
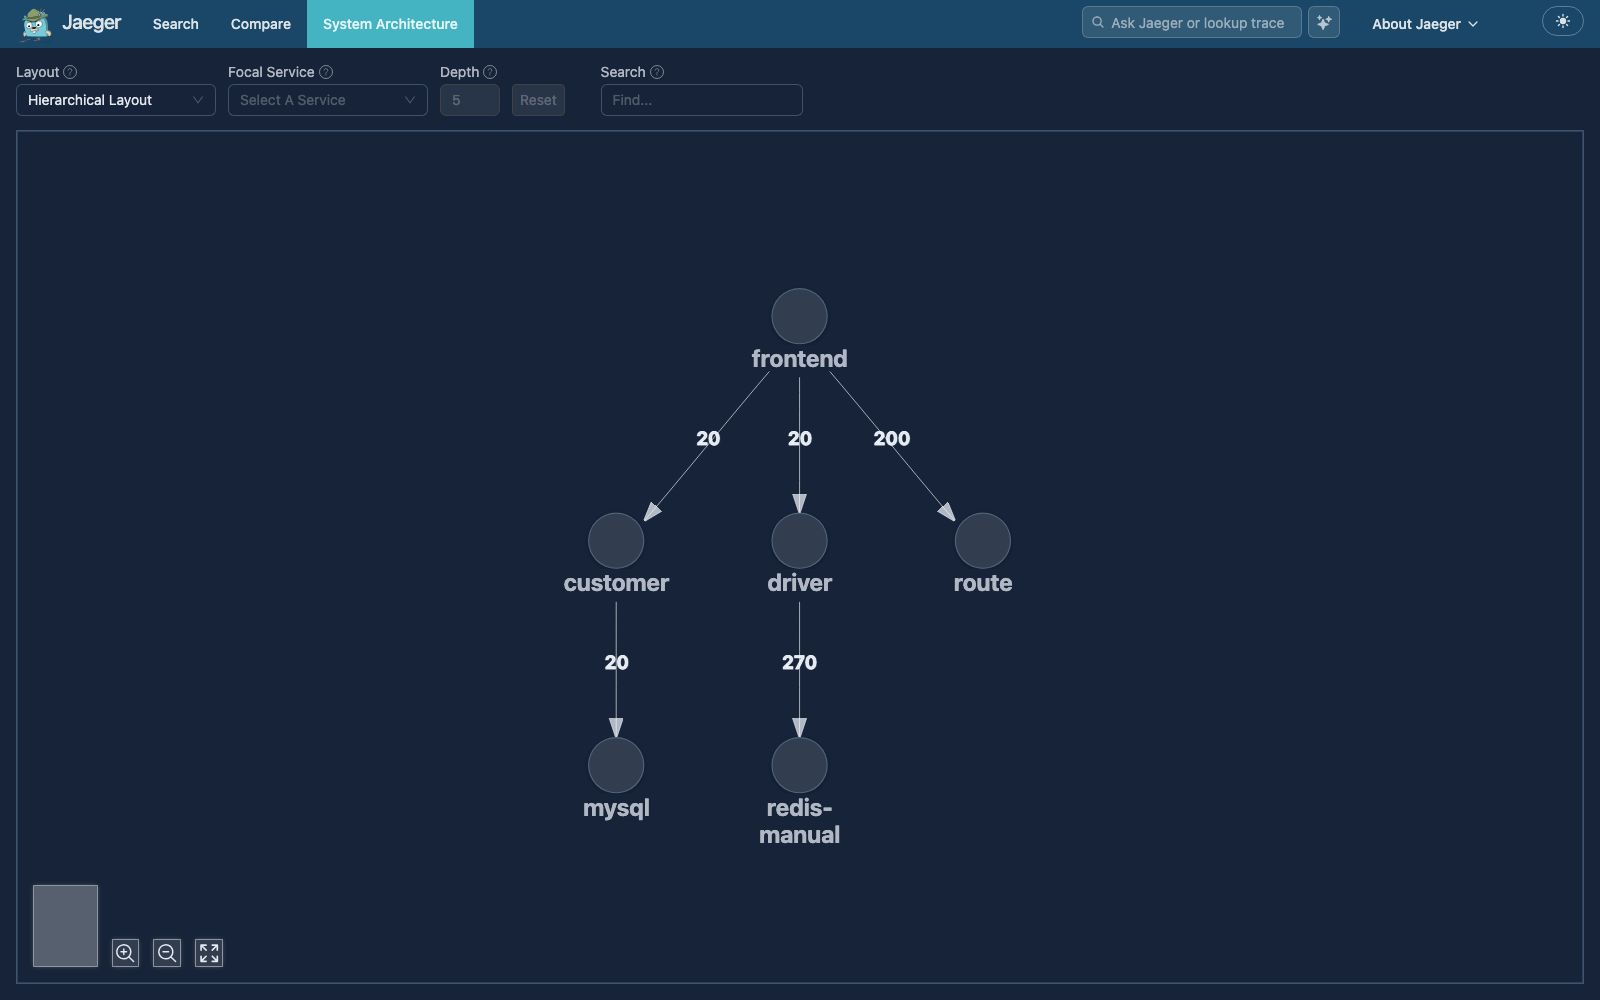
The “classic” service dependency graph for all services observed in the architecture. The graph represents only one-hop dependencies between services, similar to what one could get from telemetry produced by service meshes. For example, a graph A - B - C means that there are some traces that contain network calls between A and B, and some traces with calls between B and C. However, it does not mean there are any traces that contain the full chain A - B - C, i.e. we cannot say that A depends on C.
The node granularity of this graph is services only, not service endpoints.
The System Architecture graph can be built on the fly from in-memory storage, or by using Spark or Flink jobs when using distributed storage.
Deep Dependency Graph
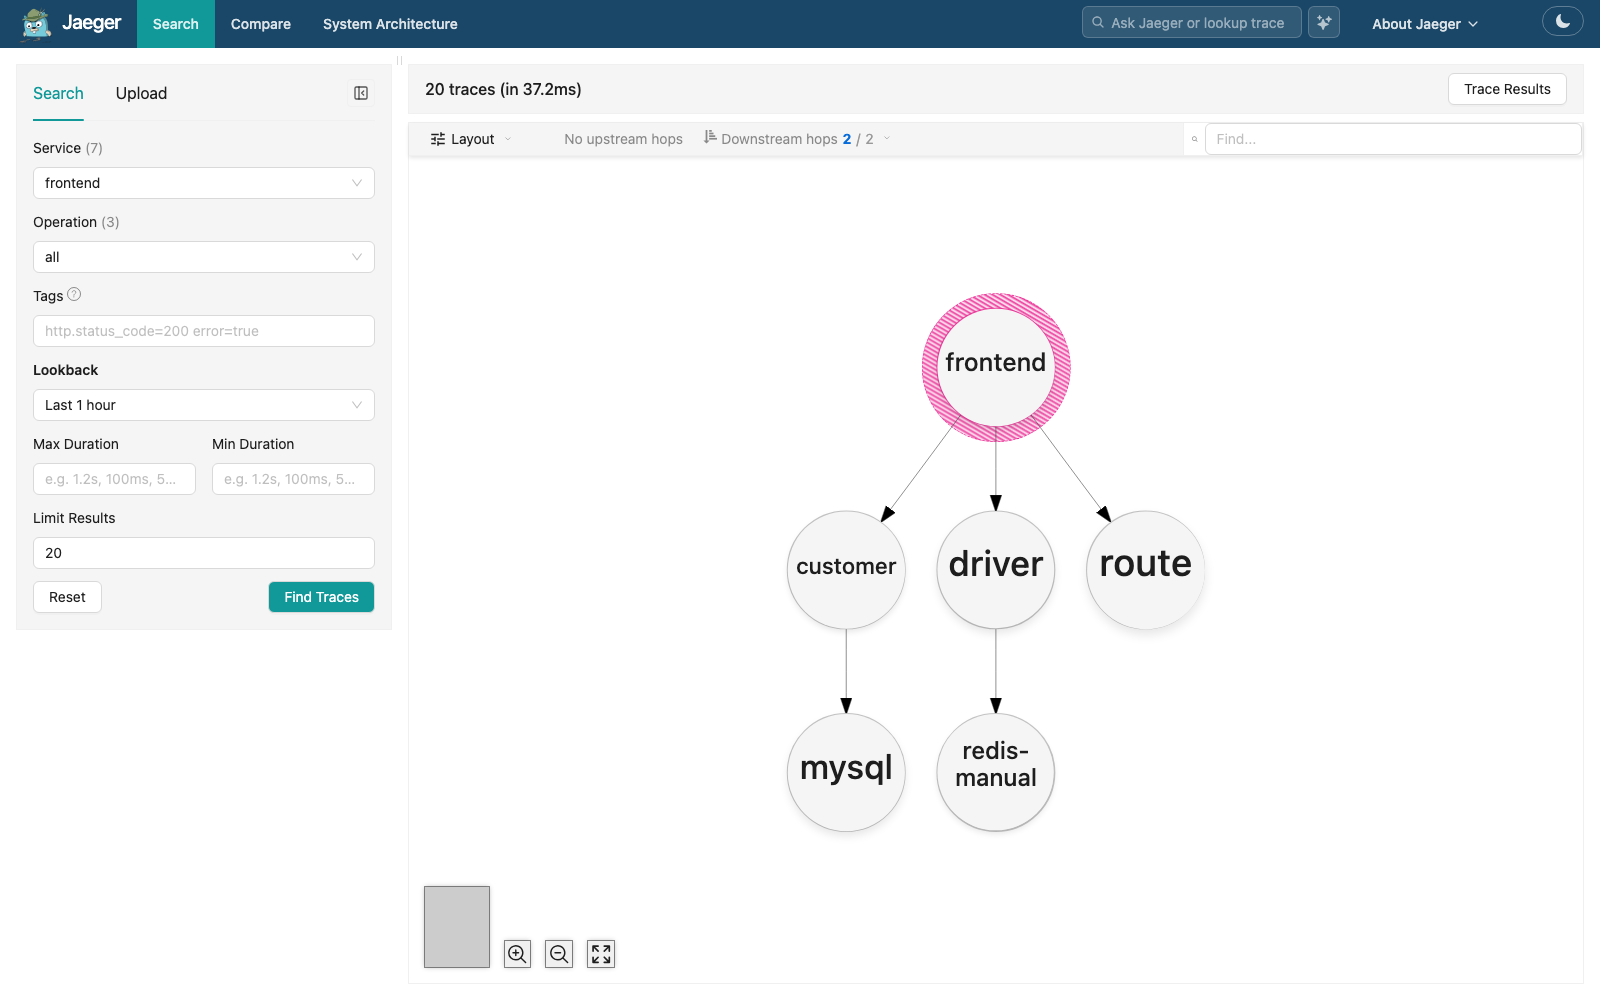
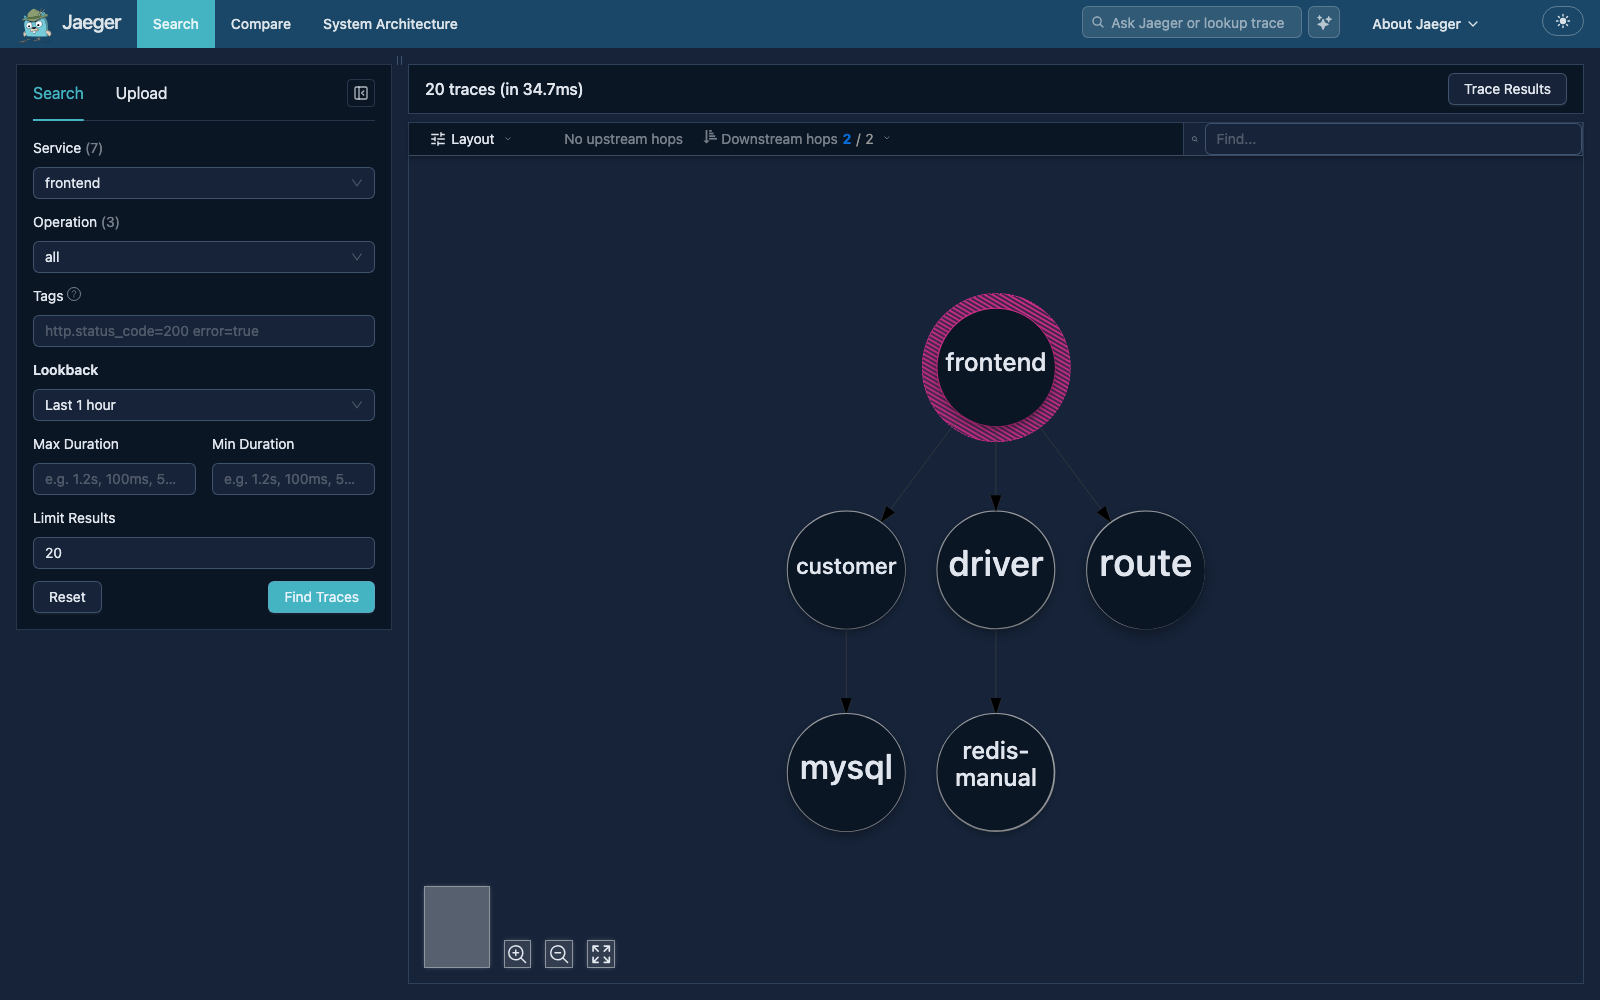
Also known as “Transitive Dependency Graph”, where a chain A -> B -> C means that A has a transitive dependency on C. A single graph requires a “focal” service (shown in pink) and only displays the paths passing through that service. Typically, this type of graph does not represent the full architecture of the system, unless there is a service that is connected to everything, e.g. an API gateway, and it is selected as a focal service.
The node granularity of this graph can be changed between services and service endpoints. In the latter mode, different endpoints in the same service will be displayed as separate nodes, e.g. A::op1 and A::op2.
At this time the transitive graph can only be constructed from traces in the search results. In the future there will be a Flink job that will compute the graphs by aggregating all traces.
Service Performance Monitoring (SPM)
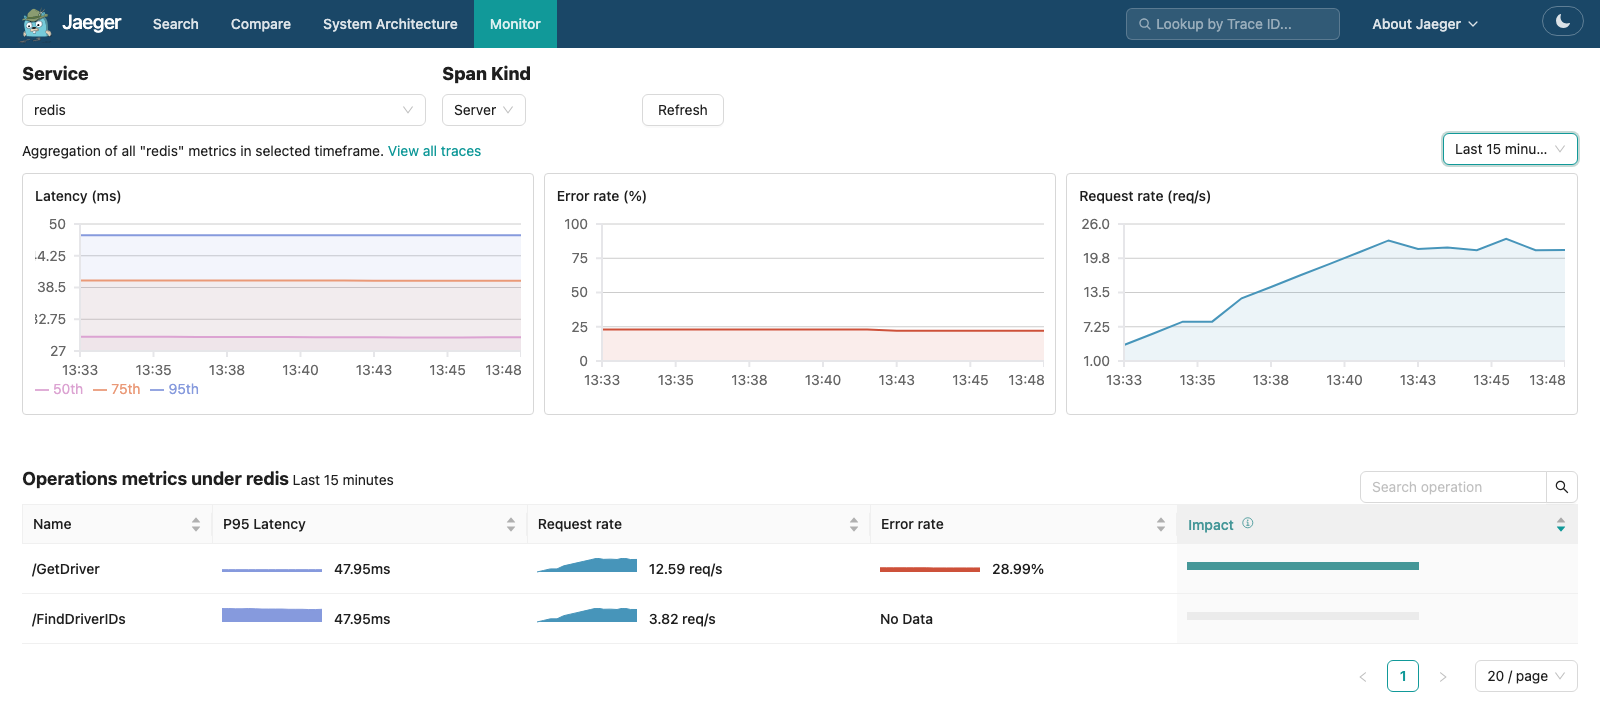
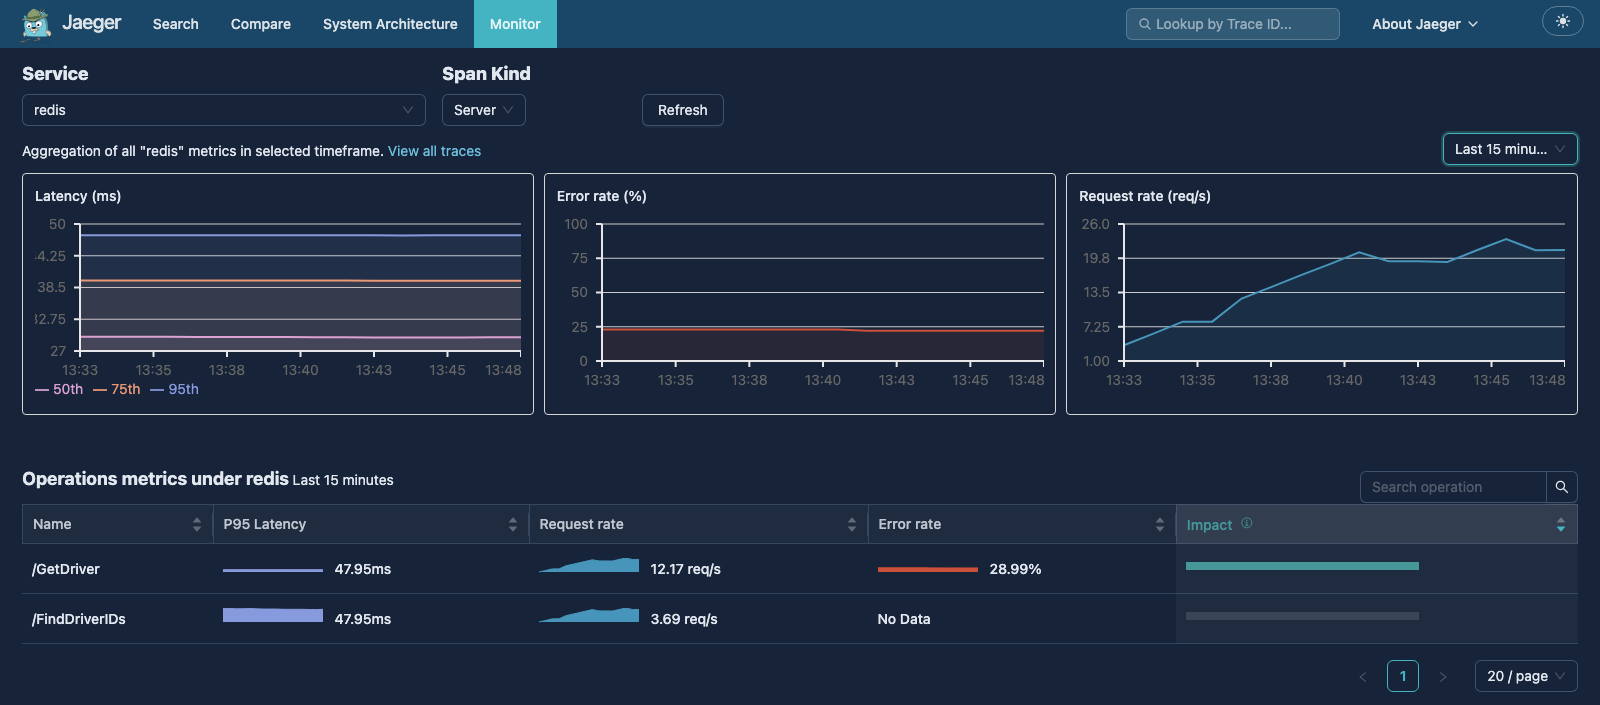
SPM allows monitoring and investigating trends in the performance of the services by computing aggregate metrics from traces and visualizing them as time series charts. It is a powerful tool to identify and investigate performance issues,
See Service Performance Monitoring (SPM) for more details.
AI Assistant and MCP Server
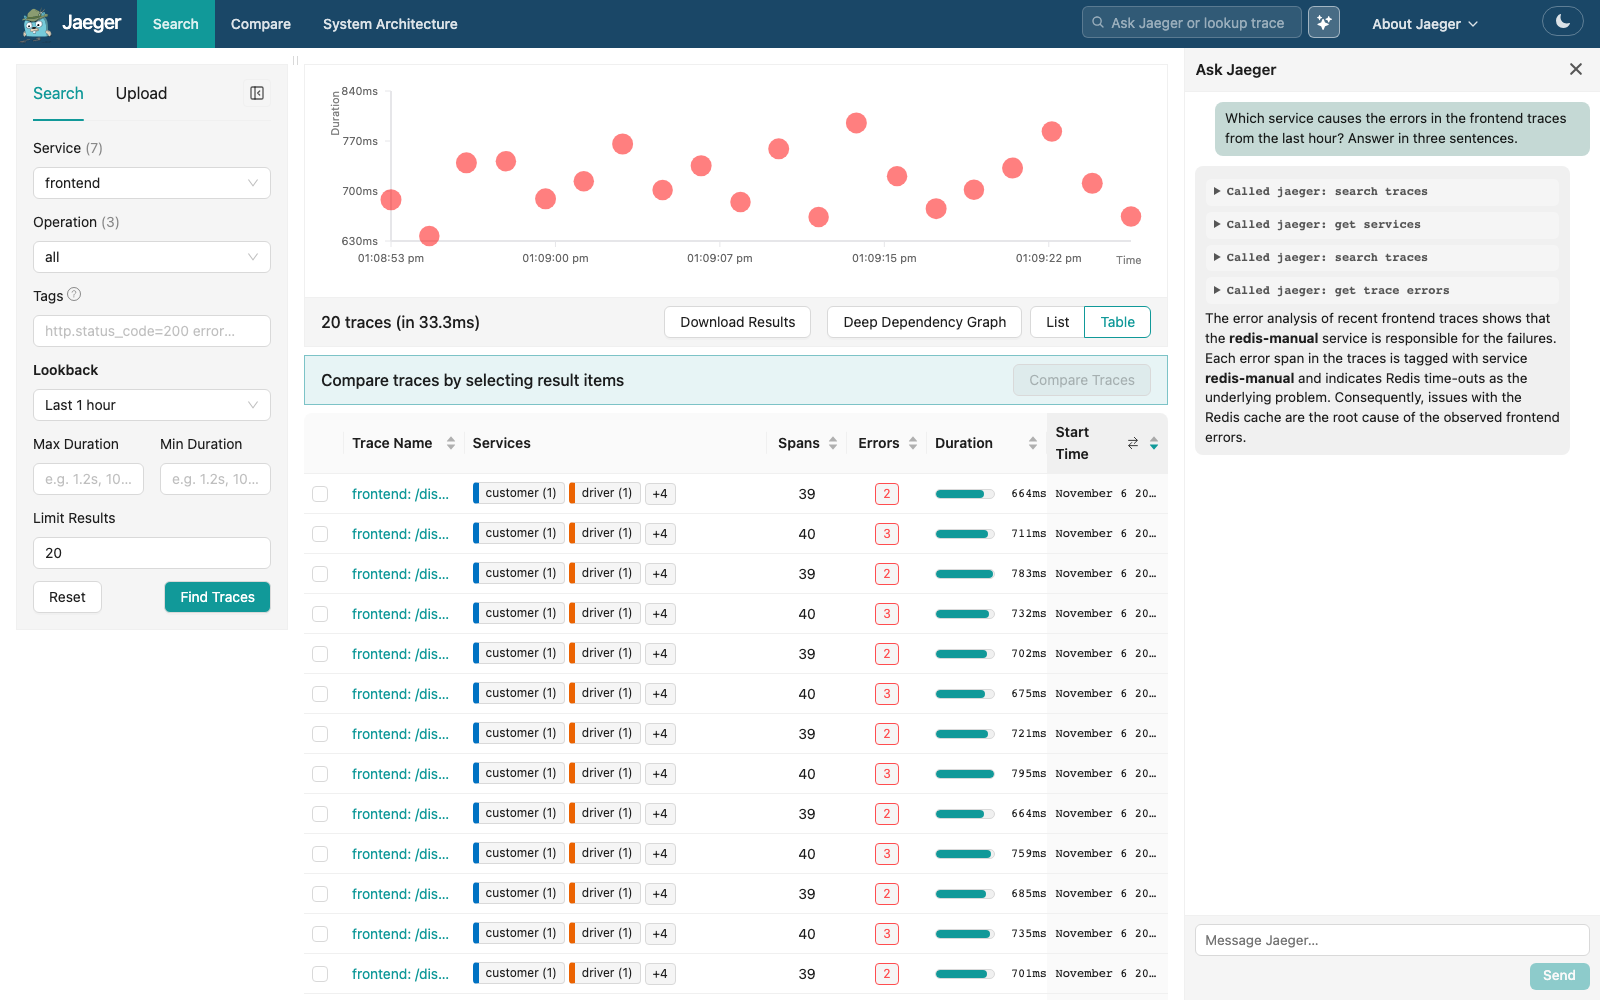
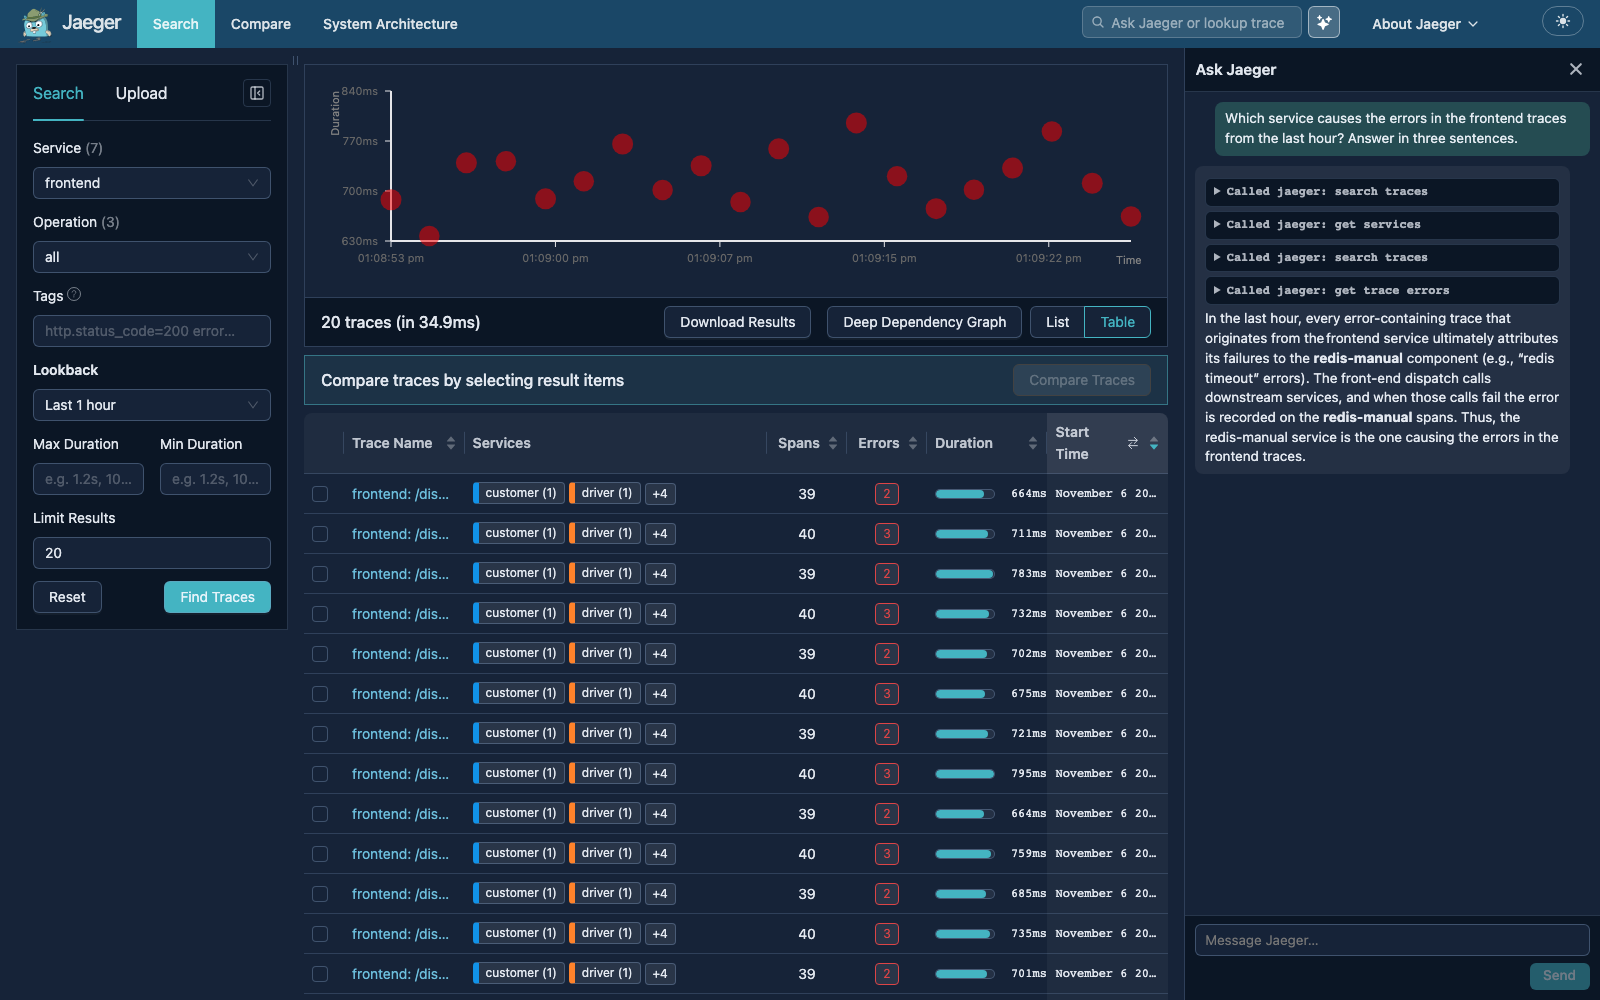
Jaeger supports AI capabilities in two ways. It exposes an MCP server to external AI agents, with a set of tools shaped so that an agent narrows down to the suspicious spans without loading a whole trace into its context. And it accepts AI chat clients over the AG-UI protocol, relaying each conversation to an agent that the operator runs, which answers with the same tools. The built-in AI Assistant chat interface in the Jaeger UI is one such client. Jaeger ships no agent and no model provider.
See AI Assistant and MCP Server for more details.
GenAI Trace View
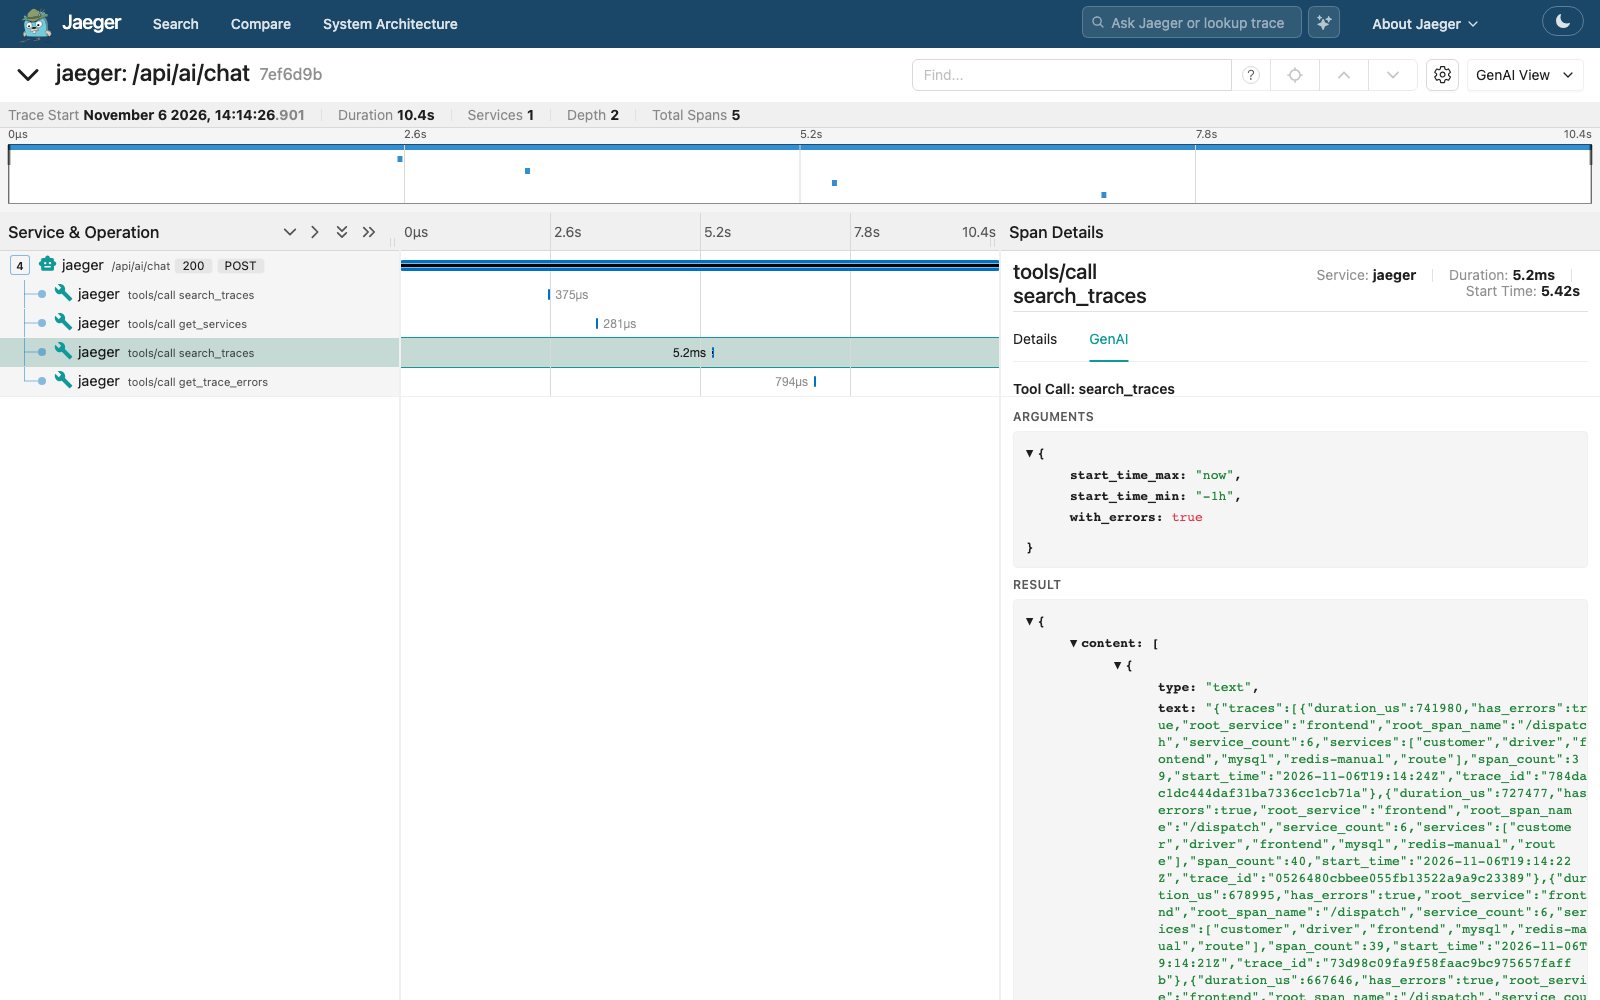
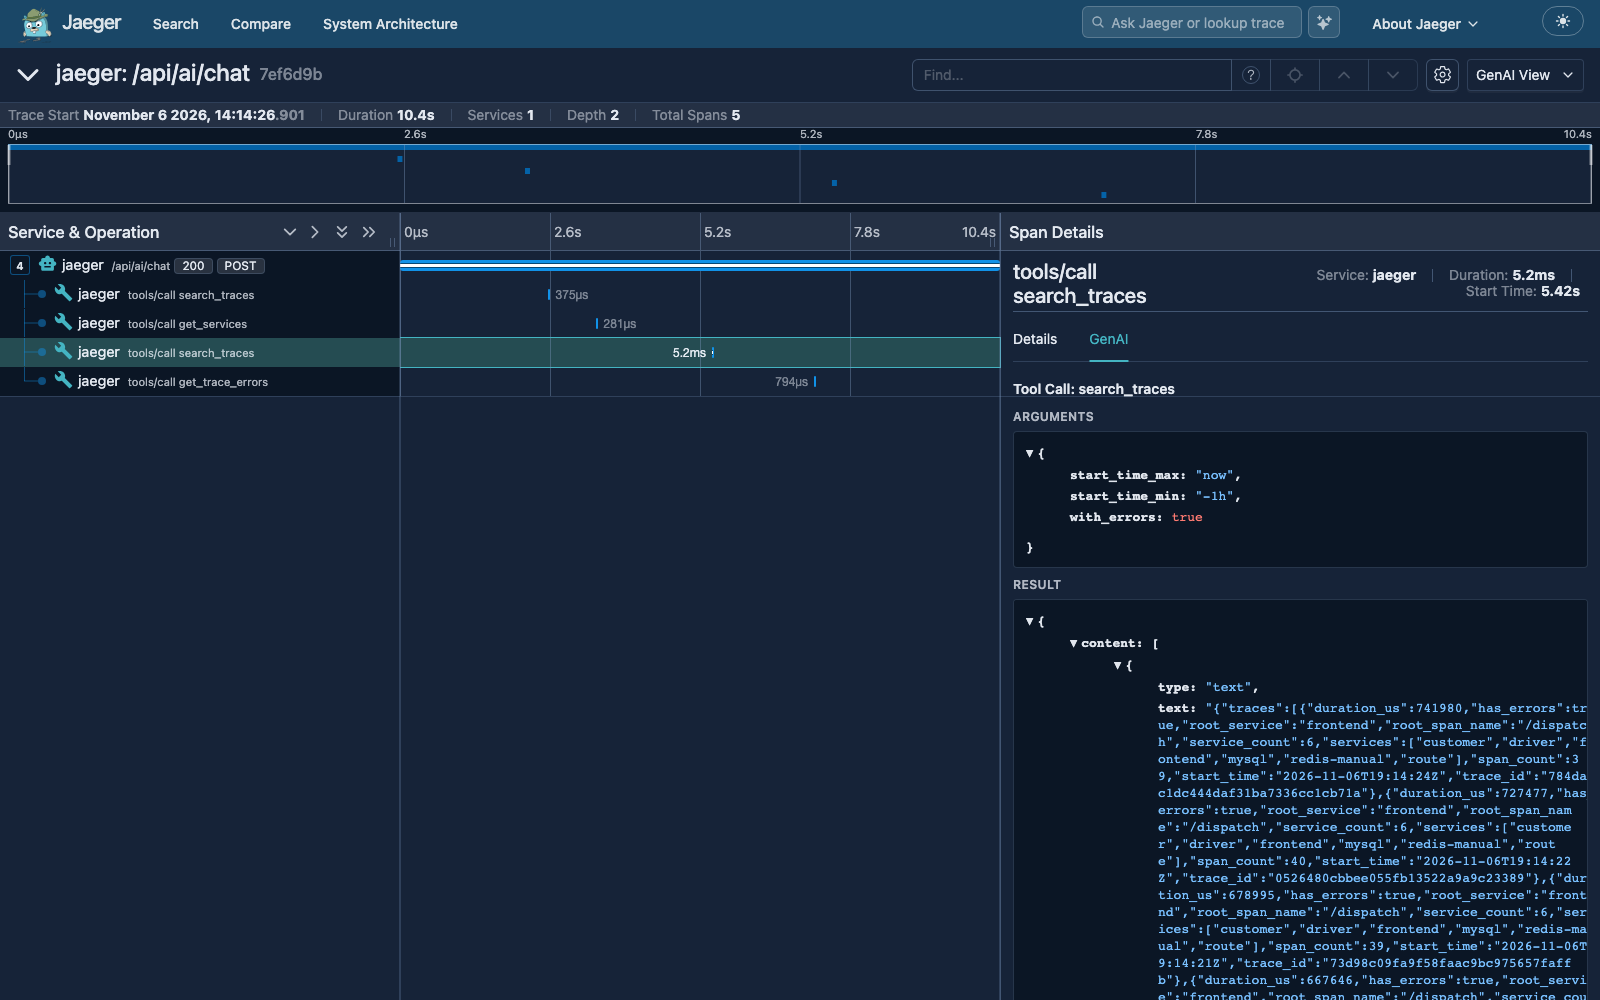
Jaeger UI recognizes spans that follow the OpenTelemetry semantic conventions for generative AI. Agent and tool-call spans get their own icons in the timeline, and the span details show the tool’s arguments and result in a GenAI tab. The trace above is one AI Assistant turn: the chat request and the tool calls the agent made.
Embedding and Grafana Plugin
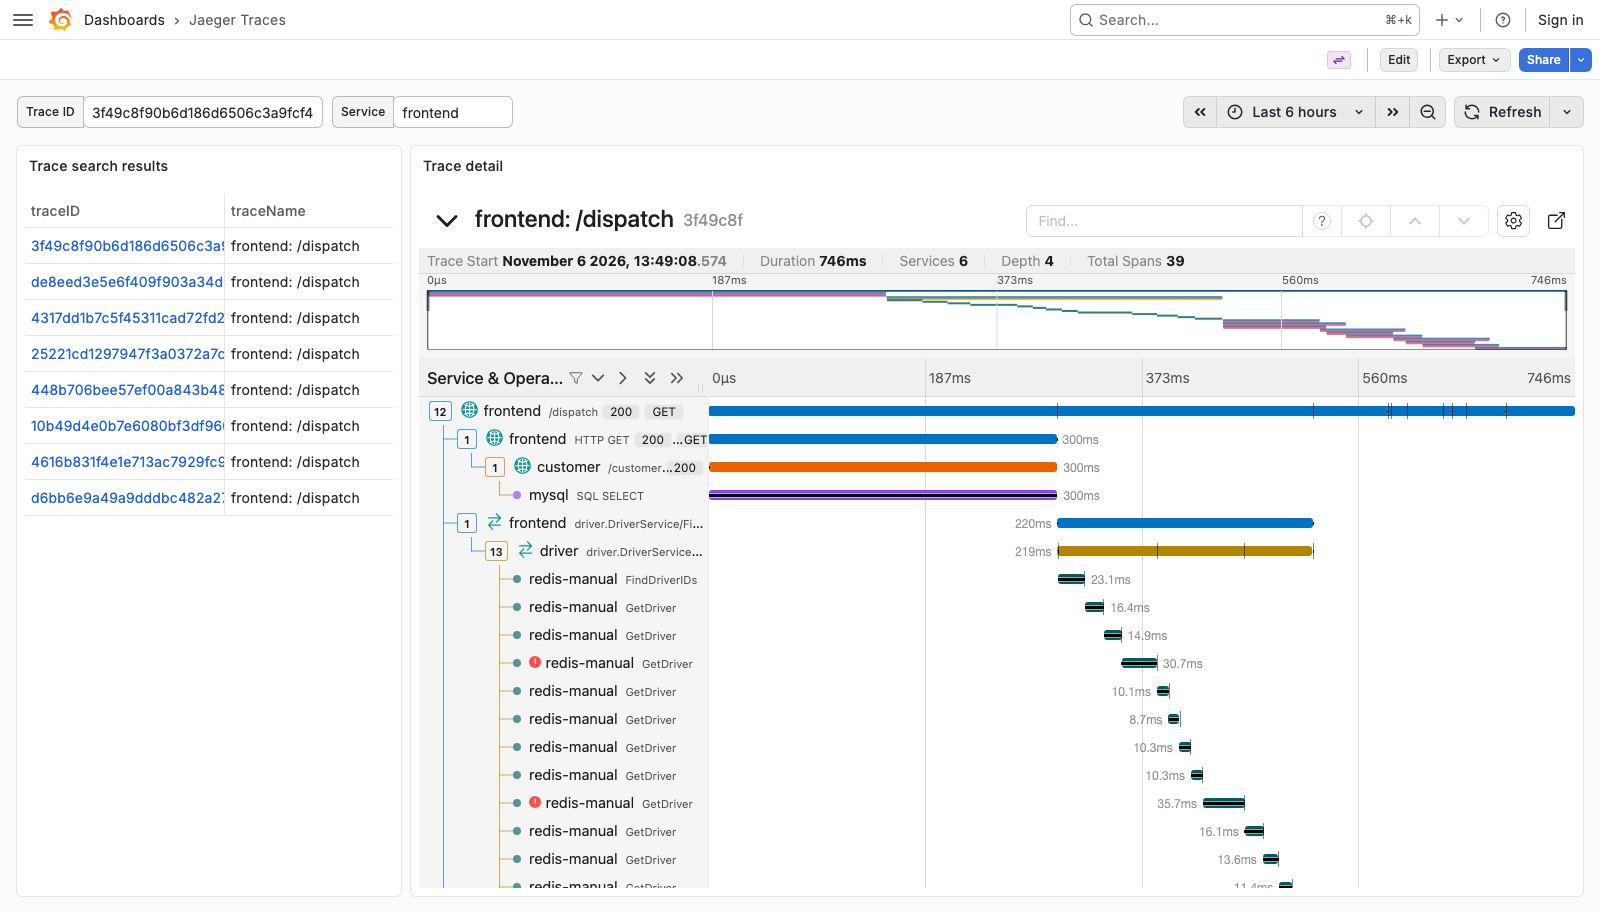
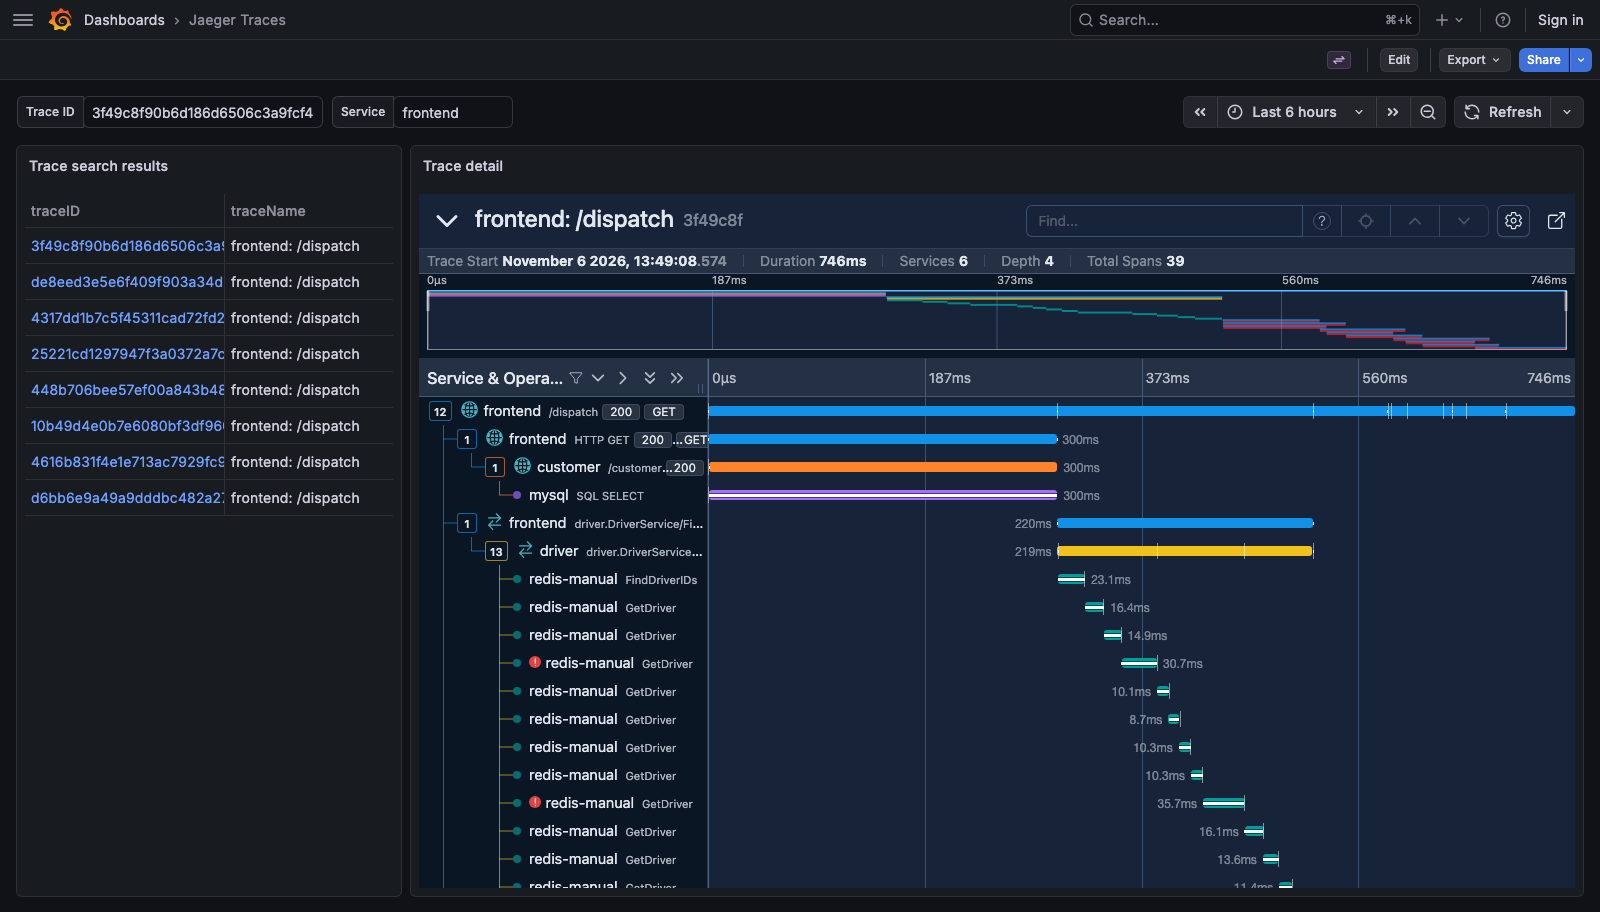
Jaeger UI has an embedded mode that drops its navigation so that it fits inside another application. The Jaeger plugin for Grafana uses it to show trace search and trace views in dashboard panels.
Zipkin Compatibility
Although we recommend instrumenting applications with OpenTelemetry, if your organization has already invested in the instrumentation using Zipkin libraries, you do not have to rewrite all that code. Jaeger provides backwards compatibility with Zipkin by accepting spans in Zipkin formats (Thrift, JSON v1/v2 and Protobuf) over HTTP. Switching from a Zipkin backend is just a matter of routing the traffic from Zipkin libraries to the Jaeger backend.
