Service Performance Monitoring (SPM)
Surfaced in Jaeger UI as the “Monitor” tab, the motivation for this feature is to help identify interesting traces (e.g. high QPS, slow or erroneous requests) without needing to know the service or operation names up-front.
It is essentially achieved through aggregating span data to produce RED (Request, Error, Duration) metrics.
Potential use cases include:
- Post deployment sanity checks across the org, or on known dependent services in the request chain.
- Monitoring and root-causing when alerted of an issue.
- Better onboarding experience for new users of Jaeger UI.
- Long-term trend analysis of QPS, errors and latencies.
- Capacity planning.
UI Feature Overview
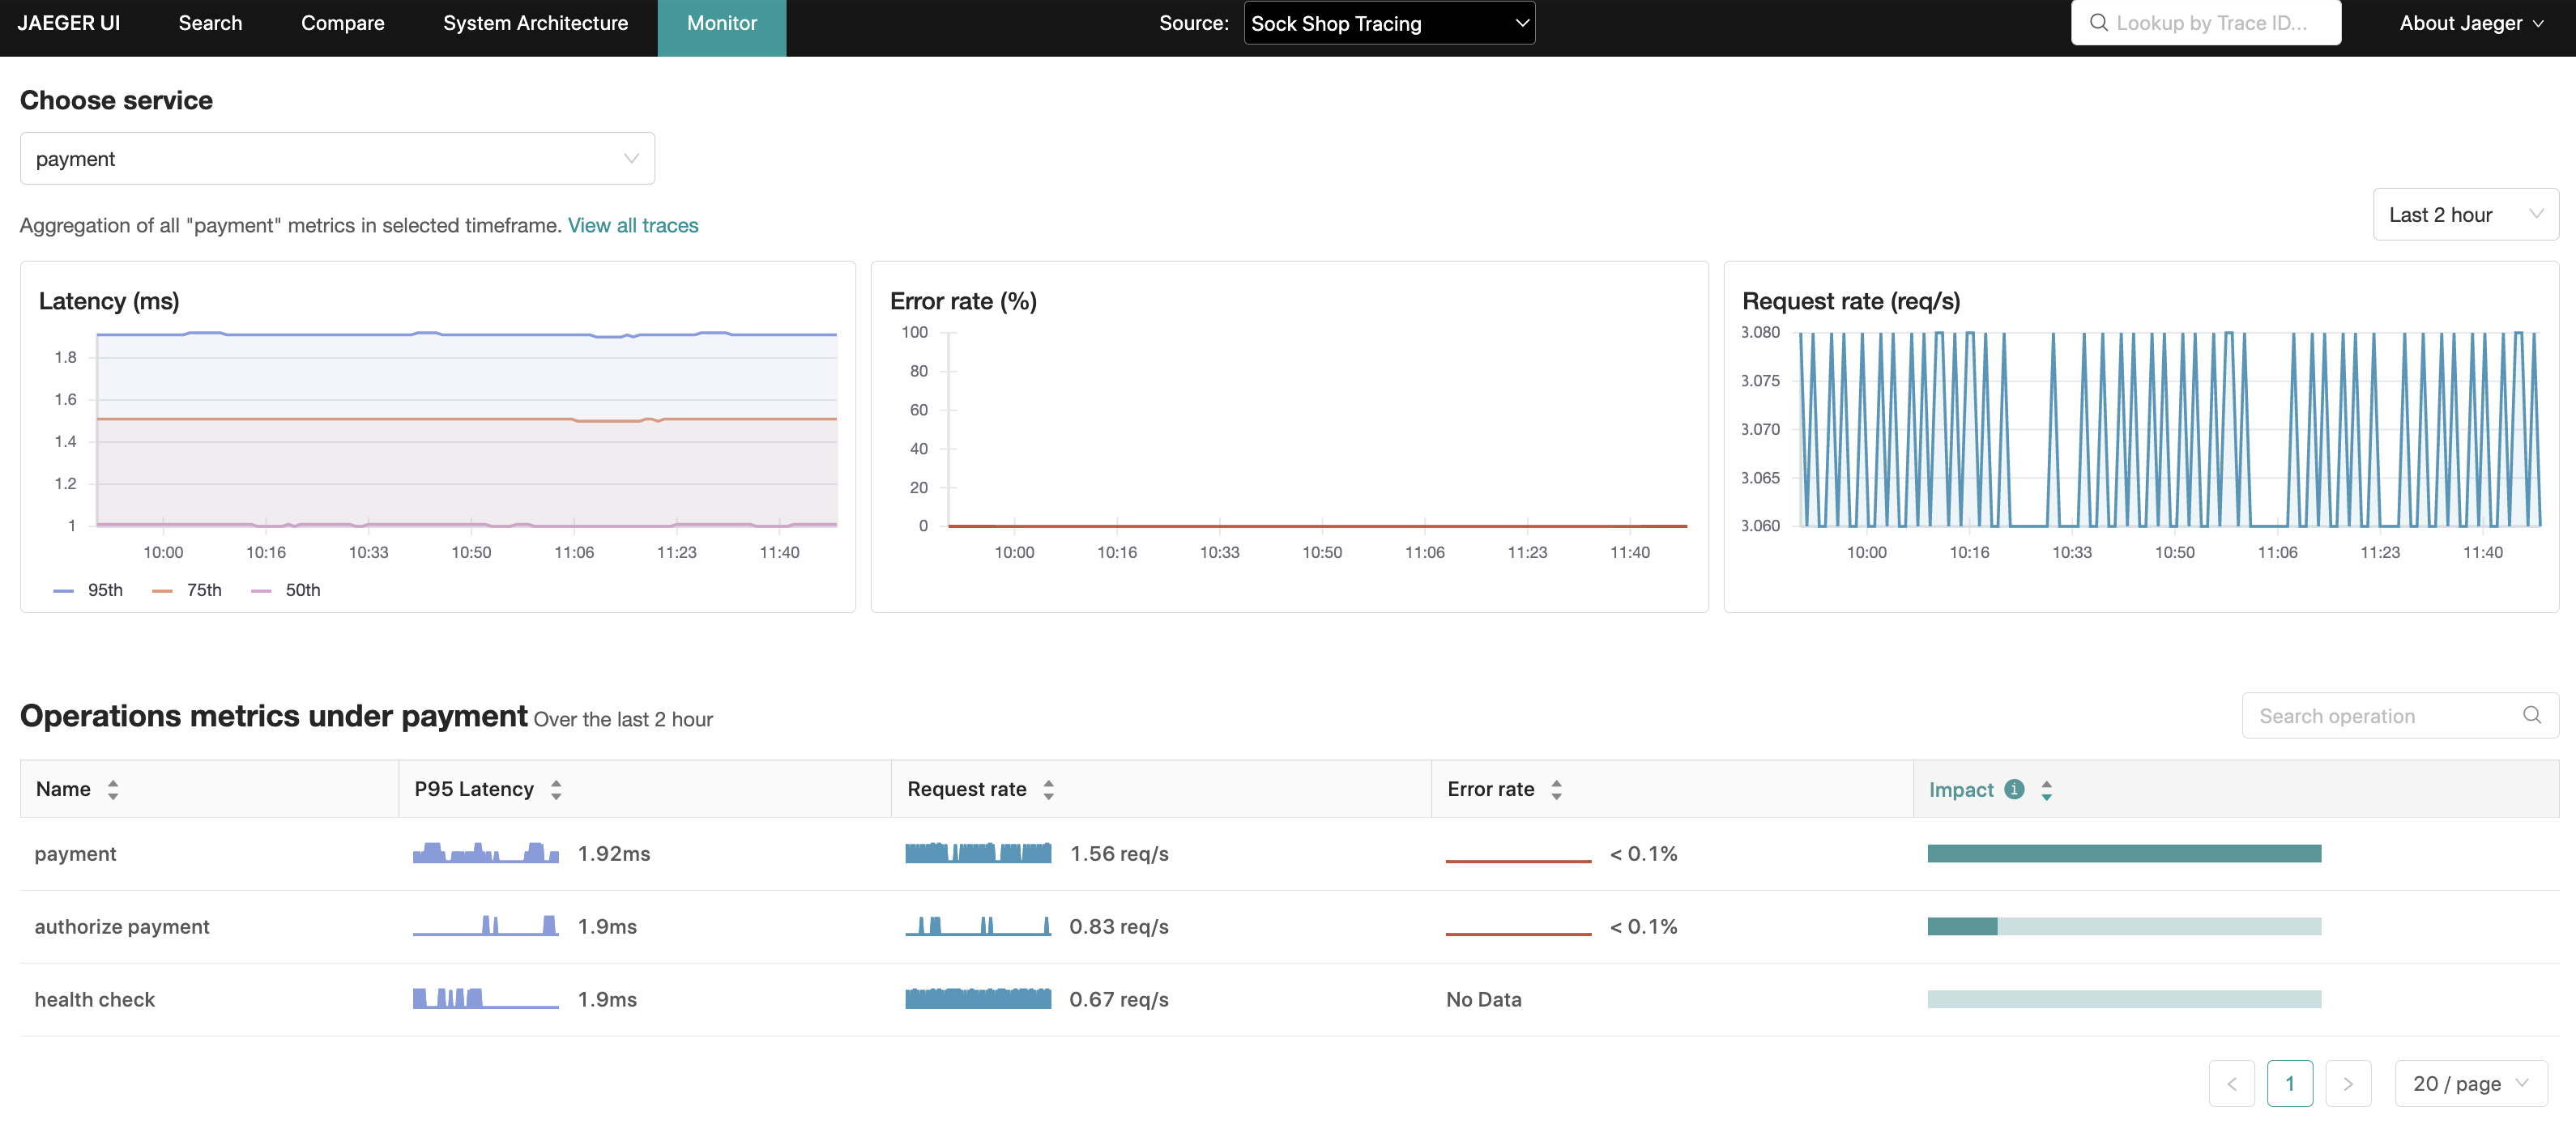
The “Monitor” tab provides a service-level aggregation, as well as an operation-level aggregation within the service, of Request rates, Error rates and Durations (P95, P75 and P50), also known as RED metrics.
Within the operation-level aggregations, an “Impact” metric, computed as the product of latency and request rate, is another signal that can be used to rule-out operations that may naturally have a high latency profile such as daily batch jobs, or conversely highlight operations that are lower in the latency rankings but with a high RPS (request per second).
From these aggregations, Jaeger UI is able to pre-populate a Trace search with the relevant service, operation and lookback period, narrowing down the search space for these more interesting traces.
Getting Started
A locally runnable setup is available in the Jaeger repository along with instructions on how to run it.
The feature can be accessed from the “Monitor” tab along the top menu.
This demo includes Microsim; a microservices simulator to generate trace data.
If generating traces manually is preferred, the Sample App: HotROD
can be started via docker. Be sure to include --net monitor_backend in the docker run command.
Architecture
The RED metrics queried by Jaeger for the Monitor tab are the result of span data collected by the OpenTelemetry Collector which is then aggregated by the SpanMetrics Connector component configured within its pipeline.
These metrics are finally exported by the OpenTelemetry Collector (via prometheus exporters) to a Prometheus-compatible metrics store.
It is important emphasize that this is a “read-only” feature and, as such, is only relevant to the Jaeger Query component (and All In One).
Derived Time Series
Though more in scope of the OpenTelemetry Collector, it is worth understanding the additional metrics and time series that the SpanMetrics Connector will generate in metrics storage to help with capacity planning when deploying SPM.
Please refer to Prometheus documentation covering the concepts of metric names, types, labels and time series; terms that will be used in the remainder of this section.
Two metric names will be created:
calls_total- Type: counter
- Description: counts the total number of spans, including error spans.
Call counts are differentiated from errors via the
status_codelabel. Errors are identified as any time series with the labelstatus_code = "STATUS_CODE_ERROR".
[namespace_]duration_[units]- Type: histogram
- Description: a histogram of span durations/latencies. Under the hood, Prometheus histograms
will create a number of time series. For illustrative purposes, assume no namespace
is configured and the units are
milliseconds:duration_milliseconds_count: The total number of data points across all buckets in the histogram.duration_milliseconds_sum: The sum of all data point values.duration_milliseconds_bucket: A collection ofntime series (wherenis the number of duration buckets) for each duration bucket identified by anle(less than or equal to) label. Theduration_milliseconds_bucketcounter with lowestleandle >= span durationwill be incremented for each span.
The following formula aims to provide some guidance on the number of new time series created:
num_status_codes * num_span_kinds * (1 + num_latency_buckets) * num_operations

Where:
  num_status_codes = 3 max (typically 2: ok/error)
  num_span_kinds = 6 max (typically 2: client/server)
  num_latency_buckets = 17 default
Plugging those numbers in, assuming default configuration:
max = 324 * num_operations
typical = 72 * num_operations
Note:
- Custom duration buckets or dimensions configured in the spanmetrics connector will alter the calculation above.
- Querying custom dimensions are not supported by SPM and will be aggregated over.
Configuration
Enabling SPM
The following configuration is required to enable the SPM feature:
- Jaeger UI
- Jaeger Query
- Set the
METRICS_STORAGE_TYPEenvironment variable toprometheus. - Optional: Set
--prometheus.server-url(orPROMETHEUS_SERVER_URLenvironment variable) to the URL of the prometheus server. Default: http://localhost:9090.
- Set the
API
gRPC/Protobuf
The recommended way to programmatically retrieve RED metrics is via jaeger.api_v2.metrics.MetricsQueryService gRPC endpoint defined in the metricsquery.proto IDL file.
HTTP JSON
Used internally by the Monitor tab of Jaeger UI to populate the metrics for its visualizations.
Refer to this README file for a detailed specification of the HTTP API.
Troubleshooting
Check the /metrics endpoint
The /metrics endpoint can be used to check if spans for specific services were received.
The /metrics endpoint is served from the admin port.
Assuming that Jaeger all-in-one and query are available under hosts named all-in-one
and jaeger-query respectively, here are sample curl calls to obtain the metrics:
$ curl http://all-in-one:14269/metrics

$ curl http://jaeger-query:16687/metrics
The following metrics are of most interest:
# all-in-one
jaeger_requests_total
jaeger_latency_bucket

# jaeger-query
jaeger_query_requests_total
jaeger_query_latency_bucket
Each of these metrics will have a label for each of the following operations:
get_call_rates
get_error_rates
get_latencies
get_min_step_duration
If things are working as expected, the metrics with label result="ok" should
be incrementing, and result="err" being static. For example:
jaeger_query_requests_total{operation="get_call_rates",result="ok"} 18
jaeger_query_requests_total{operation="get_error_rates",result="ok"} 18
jaeger_query_requests_total{operation="get_latencies",result="ok"} 36

jaeger_query_latency_bucket{operation="get_call_rates",result="ok",le="0.005"} 5
jaeger_query_latency_bucket{operation="get_call_rates",result="ok",le="0.01"} 13
jaeger_query_latency_bucket{operation="get_call_rates",result="ok",le="0.025"} 18

jaeger_query_latency_bucket{operation="get_error_rates",result="ok",le="0.005"} 7
jaeger_query_latency_bucket{operation="get_error_rates",result="ok",le="0.01"} 13
jaeger_query_latency_bucket{operation="get_error_rates",result="ok",le="0.025"} 18

jaeger_query_latency_bucket{operation="get_latencies",result="ok",le="0.005"} 7
jaeger_query_latency_bucket{operation="get_latencies",result="ok",le="0.01"} 25
jaeger_query_latency_bucket{operation="get_latencies",result="ok",le="0.025"} 36
If there are issues reading metrics from Prometheus such as a failure to reach
the Prometheus server, then the result="err" metrics will be incremented. For example:
jaeger_query_requests_total{operation="get_call_rates",result="err"} 4
jaeger_query_requests_total{operation="get_error_rates",result="err"} 4
jaeger_query_requests_total{operation="get_latencies",result="err"} 8
At this point, checking the logs will provide more insight towards root causing the problem.
Query Prometheus
Graphs may still appear empty even when the above Jaeger metrics indicate successful reads from Prometheus. In this case, query Prometheus directly on any of these metrics:
duration_bucketduration_milliseconds_bucketduration_seconds_bucketcallscalls_total
You should expect to see these counters increasing as spans are being emitted by services to the OpenTelemetry Collector.
Viewing Logs
If the above metrics are present in Prometheus, but not appearing in the Monitor tab, it means there is a discrepancy between what metrics Jaeger expects to see in Prometheus and what metrics are actually available.
This can be confirmed by increasing the log level by setting the following environment variable:
LOG_LEVEL=debug
Outputting logs that resemble the following:
{
    "level": "debug",
    "ts": 1688042343.4464543,
    "caller": "metricsstore/reader.go:245",
    "msg": "Prometheus query results",
    "results": "",
    "query": "sum(rate(calls{service_name =~ \"driver\", span_kind =~ \"SPAN_KIND_SERVER\"}[10m])) by (service_name,span_name)",
    "range":
    {
        "Start": "2023-06-29T12:34:03.081Z",
        "End": "2023-06-29T12:39:03.081Z",
        "Step": 60000000000
    }
}
In this instance, let’s say OpenTelemetry Collector’s prometheusexporter introduced
a breaking change that appends a _total suffix to counter metrics and the duration units within
histogram metrics (e.g. duration_milliseconds_bucket). As we discovered,
Jaeger is looking for the calls (and duration_bucket) metric names,
while the OpenTelemetry Collector is writing calls_total (and duration_milliseconds_bucket).
The resolution, in this specific case, is to set environment variables telling Jaeger
to normalize the metric names such that it knows to search for calls_total and
duration_milliseconds_bucket instead, like so:
PROMETHEUS_QUERY_NORMALIZE_CALLS=true
PROMETHEUS_QUERY_NORMALIZE_DURATION=true
Checking OpenTelemetry Collector Config
If there are error spans appearing in Jaeger, but no corresponding error metrics:
Check that raw metrics in Prometheus generated by the spanmetrics connector (as listed above:
calls,calls_total,duration_bucket, etc.) contain thestatus.codelabel in the metric that the span should belong to.If there are no
status.codelabels, check the OpenTelemetry Collector configuration file, particularly for the presence of the following configuration:exclude_dimensions: ['status.code']This label is used by Jaeger to determine if a request is erroneous.
Inspect the OpenTelemetry Collector
If the above latency_bucket and calls_total metrics are empty, then it could
be misconfiguration in the OpenTelemetry Collector or anything upstream from it.
Some questions to ask while troubleshooting are:
- Is the OpenTelemetry Collector configured correctly?
- See: https://github.com/open-telemetry/opentelemetry-collector-contrib/tree/main/connector/spanmetricsconnector
- Is the Prometheus server reachable by the OpenTelemetry Collector?
- Are the services sending spans to the OpenTelemetry Collector?
- See: https://opentelemetry.io/docs/collector/troubleshooting/
Service/Operation missing in Monitor Tab
If the service/operation is missing in the Monitor Tab, but visible in the Jaeger
Trace search service and operation drop-downs menus, a common cause of this is
the default server span kind used in metrics queries.
The service/operations you are not seeing could be from spans that are non-server
span kinds such as client or worse, unspecified. Hence, this is an instrumentation
data quality issue, and the instrumentation should set the span kind.
The reason for defaulting to server span kinds is to avoid double-counting
both ingress and egress spans in the server and client span kinds, respectively.
403 when executing metrics query
If logs contain the error resembling: failed executing metrics query: client_error: client error: 403,
it is possible that the Prometheus server is expecting a bearer token.
Jaeger Query (and all-in-one) can be configured to pass the bearer token in
metrics queries via the --prometheus.token-file command-line parameter
(or the PROMETHEUS_TOKEN_FILE environment variable), with its value set to
the path of the file containing the bearer token.
