Architecture
Terminology
Jaeger represents tracing data in a data model inspired by the OpenTracing Specification. The data model is logically very similar to OpenTelemetry Traces, with some naming differences:
| Jaeger | OpenTelemetry | Notes |
|---|---|---|
| Tags | Attributes | Both support typed values, but nested tags are not supported in Jaeger. |
| Span Logs | Span Events | Point-in-time events on the span recorded in a structured form. |
| Span References | Span Links | Jaeger’s Span References have a required type (child-of or follows-from) and always refer to predecessor spans; OpenTelemetry’s Span Links have no type, but allow attributes. |
| Process | Resource | A struct describing the entity that produces the telemetry. |
Span
A span represents a logical unit of work that has an operation name, the start time of the operation, and the duration. Spans may be nested and ordered to model causal relationships.
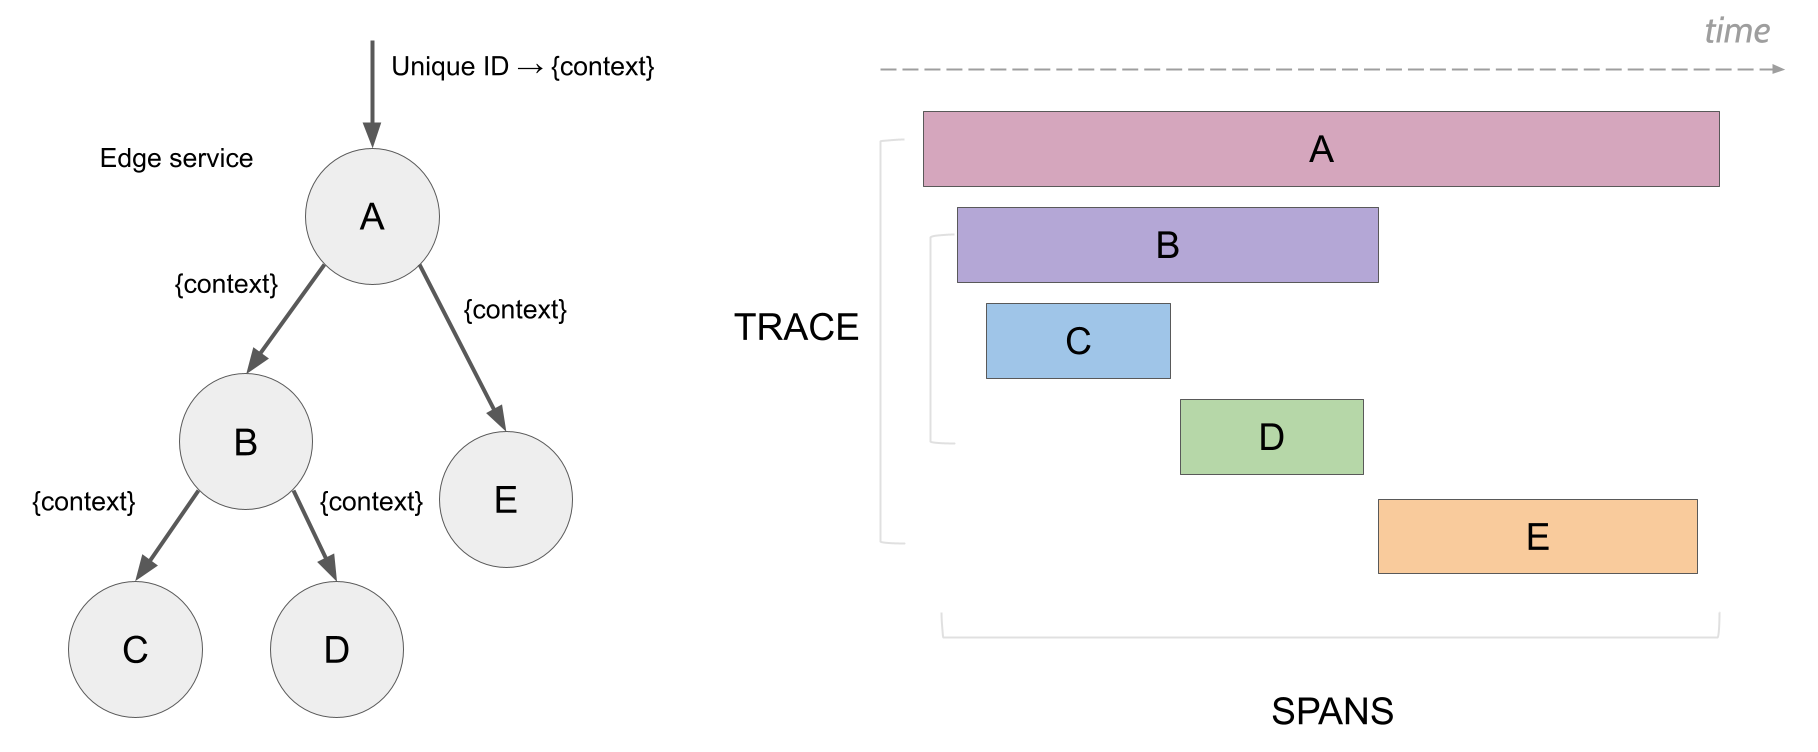
Trace
A trace represents the data or execution path through the system. It can be thought of as a directed acyclic graph of spans.
Baggage
Baggage is arbitrary user-defined metadata (key-value pairs) that can be attached to distributed context and propagated by the tracing SDKs. See W3C Baggage for more information.
Architecture
Jaeger can be deployed either as an all-in-one binary, where all Jaeger backend components run in a single process, or as a scalable distributed system. There are two main deployment options discussed below.
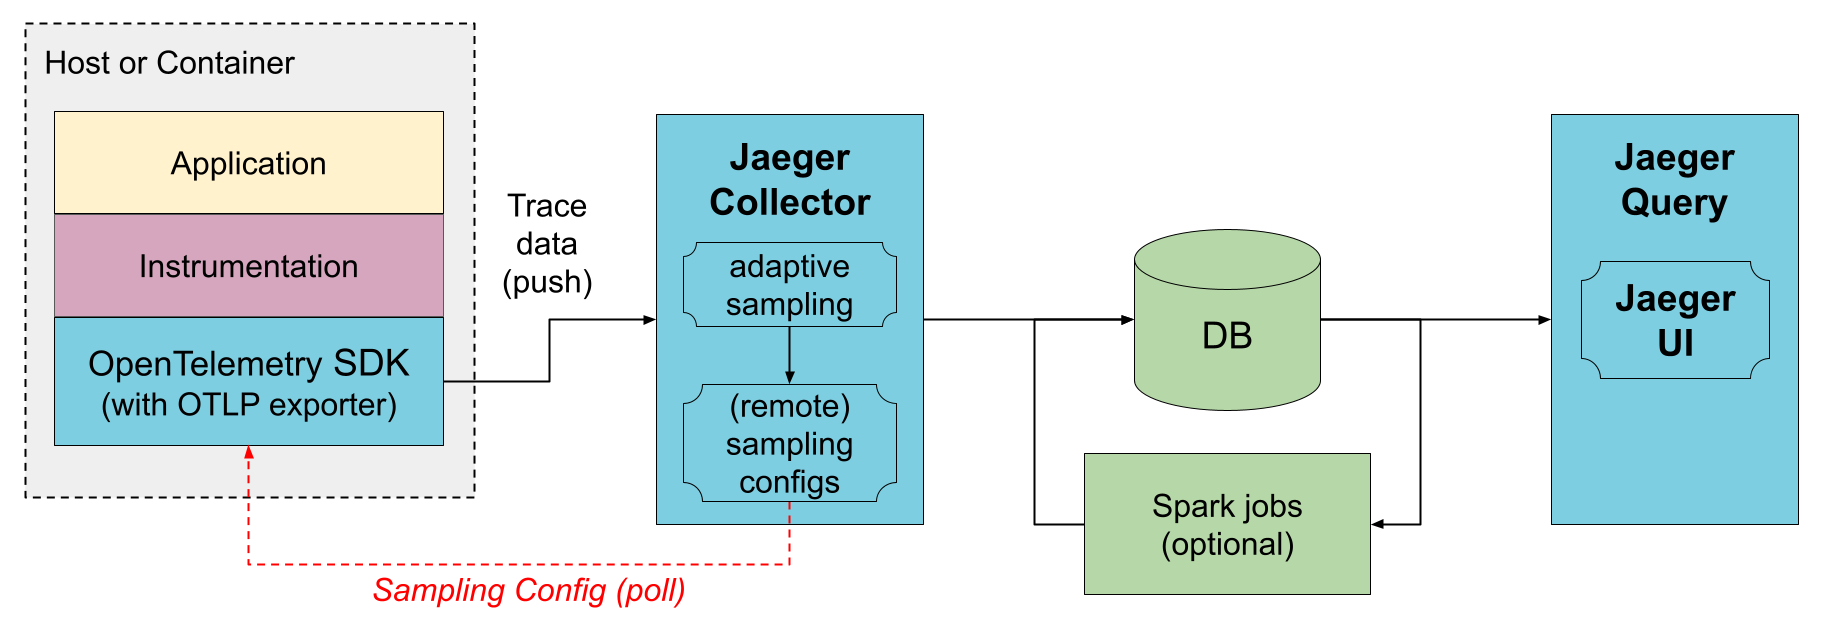
Direct to storage
In this deployment the collectors receive the data from traced applications and write it directly to storage. The storage must be able to handle both average and peak traffic. Collectors use an in-memory queue to smooth short-term traffic peaks, but a sustained traffic spike may result in dropped data if the storage is not able to keep up.
Collectors are able to centrally serve sampling configuration to the SDKs, known as remote sampling mode. They can also enable automatic sampling configuration calculation, known as adaptive sampling.
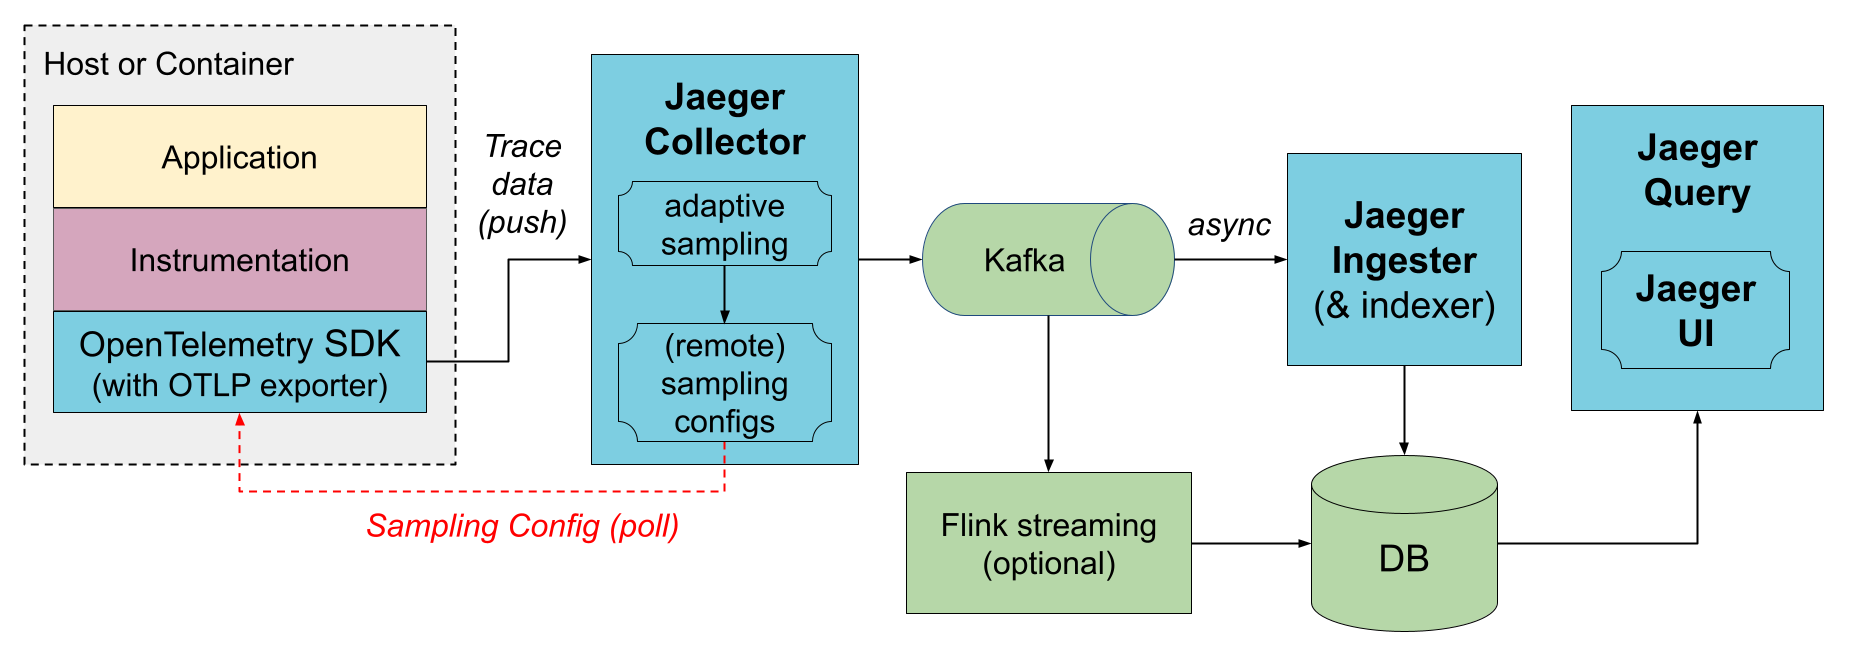
Via Kafka
To prevent data loss between collectors and storage, Kafka can be used as an intermediary, persistent queue. An additional component, jaeger-ingester, needs to be deployed to read data from Kafka and save to the database. Multiple jaeger-ingesters can be deployed to scale up ingestion; they will automatically partition the load across them.
With OpenTelemetry Collector
You do not need to use OpenTelemetry Collector, because jaeger-collector can receive OpenTelemetry data directly from the OpenTelemetry SDKs (using OTLP exporters). However, if you already use the OpenTelemetry Collectors, such as for gathering other types of telemetry or for pre-processing / enriching the tracing data, it can be placed between the SDKs and jaeger-collector’s. The OpenTelemetry Collectors can be run as an application sidecar, as a host agent / daemon, or as a central cluster.
The OpenTelemetry Collector supports Jaeger’s Remote Sampling protocol and can either serve static configurations from config files directly, or proxy the requests to the Jaeger backend (e.g., when using adaptive sampling).
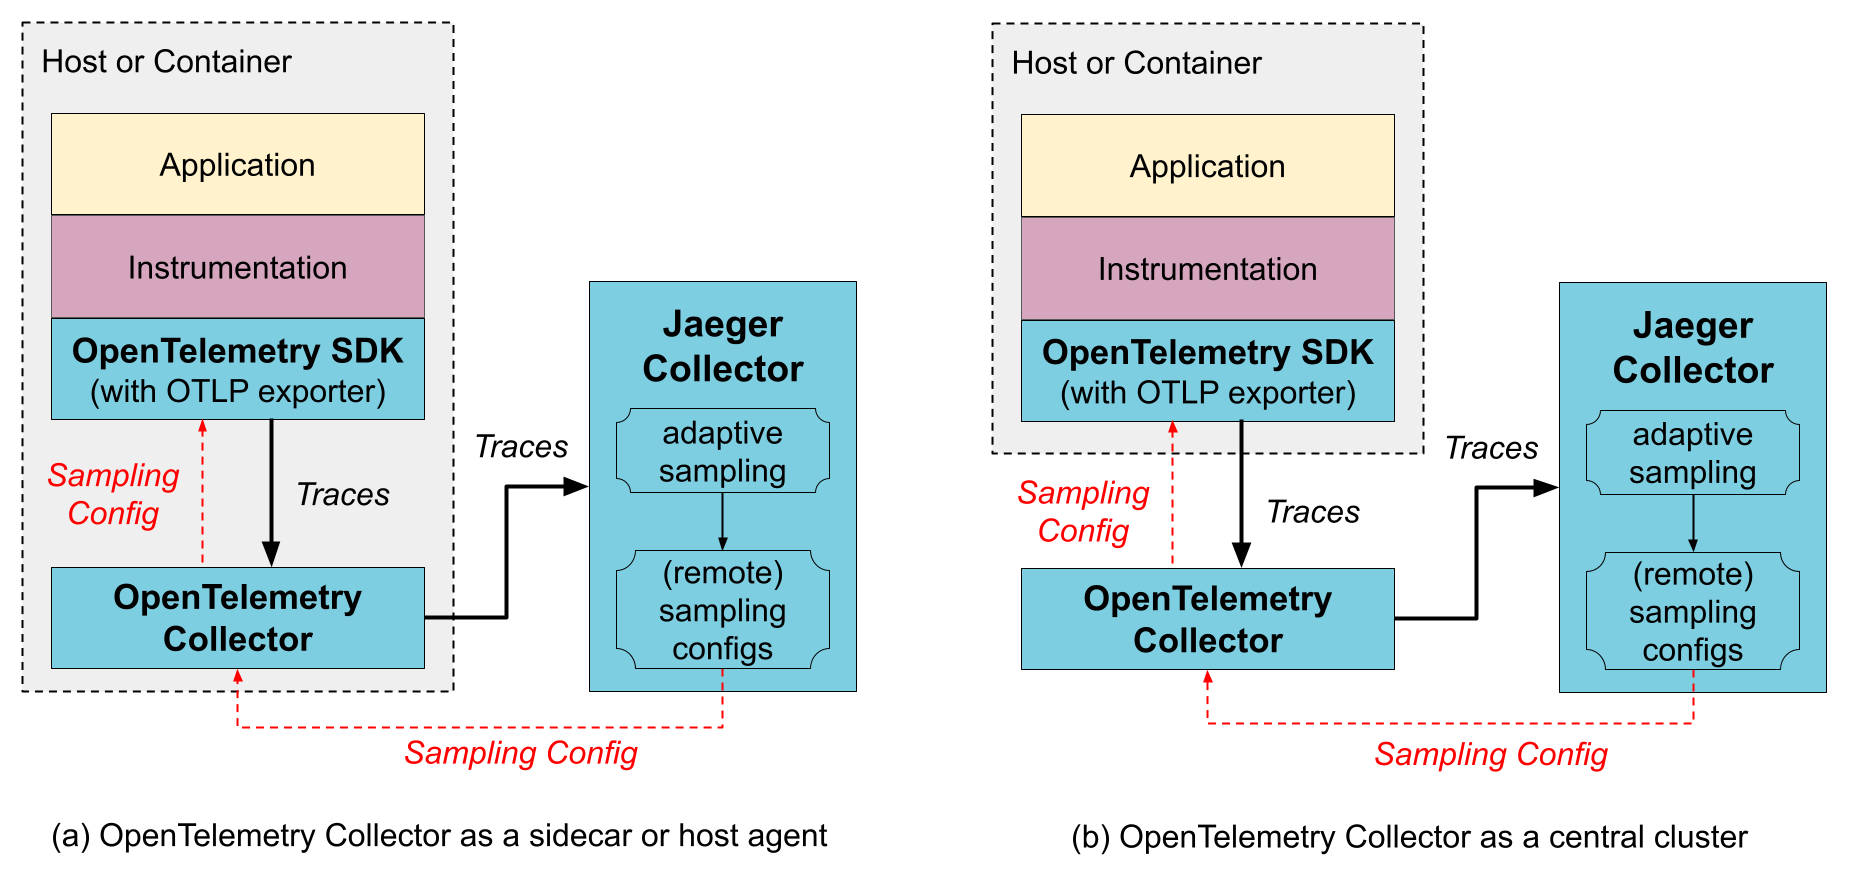
OpenTelemetry Collector as a sidecar / host agent
Benefits:
- The SDK configuration is simplified as both trace export endpoint and sampling config endpoint can point to a local host and not worry about discovering where those services run remotely.
- Collector may provide data enrichment by adding environment information, like k8s pod name.
- Resource usage for data enrichment can be distributed across all application hosts.
Downsides:
- An extra layer of marshaling/unmarshaling the data.
OpenTelemetry Collector as a remote cluster
Benefits:
- Sharding capabilities, e.g., when using tail-based sampling.
Downsides:
- An extra layer of marshaling/unmarshaling the data.
Components
This section details the constituent parts of Jaeger and how they relate to each other. It is arranged by the order in which spans from your application interact with them.
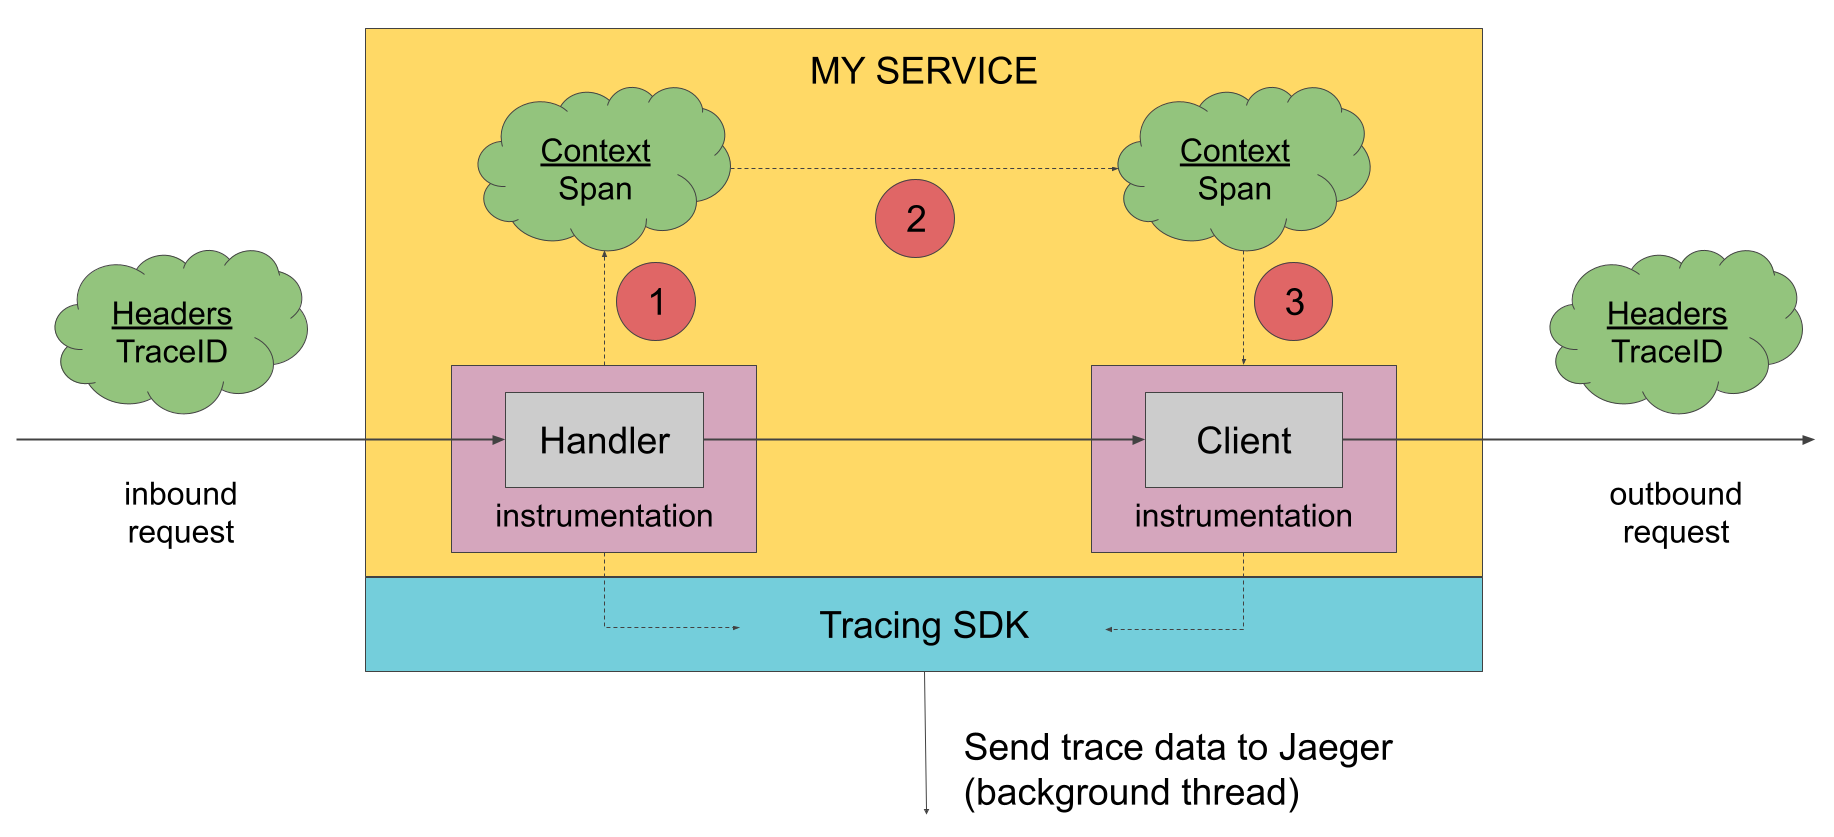
Tracing SDKs
In order to generate tracing data, the applications must be instrumented with tracing SDK such as OpenTelemetry SDKs. An instrumented application creates spans when receiving new requests and attaches context information (trace id, span id, and baggage) to outgoing requests. Only the ids and baggage are propagated with requests; all other profiling data, like operation name, timing, tags and logs, is not propagated. Instead, it is exported out of process to the Jaeger backend asynchronously, in the background.
There are many ways to instrument an application:
- manually, using the tracing APIs directly,
- relying on instrumentation already created for a variety of existing open source frameworks,
- automatically, via byte code manipulation, monkey-patching, eBPF, and similar techniques.
Instrumentation typically should not depend on specific tracing SDKs, but only on abstract tracing APIs like the OpenTelemetry API. The tracing SDKs implement the tracing APIs and take care of data export.
The instrumentation is designed to be always on in production. To minimize overhead, the SDKs employ various sampling strategies. When a trace is sampled, the profiling span data is captured and transmitted to the Jaeger backend. When a trace is not sampled, no profiling data is collected at all, and the calls to the tracing API are short-circuited to incur a minimal amount of overhead. For more information, please refer to the Sampling page.
Collector
jaeger-collector receives traces, runs them through a processing pipeline for validation and clean-up/enrichment, and stores them in a storage backend. Jaeger comes with built-in support for several storage backends (see Deployment), as well as extensible plugin framework for implementing custom storage plugins.
Query
jaeger-query is a service that exposes the APIs for retrieving traces from storage and hosts a Web UI for searching and analyzing traces.
Ingester
jaeger-ingester is a service that reads traces from Kafka and writes them to a storage backend. Effectively, it is a stripped-down version of the Jaeger collector that supports Kafka as the only input protocol.
